Seven-point phosphate panel
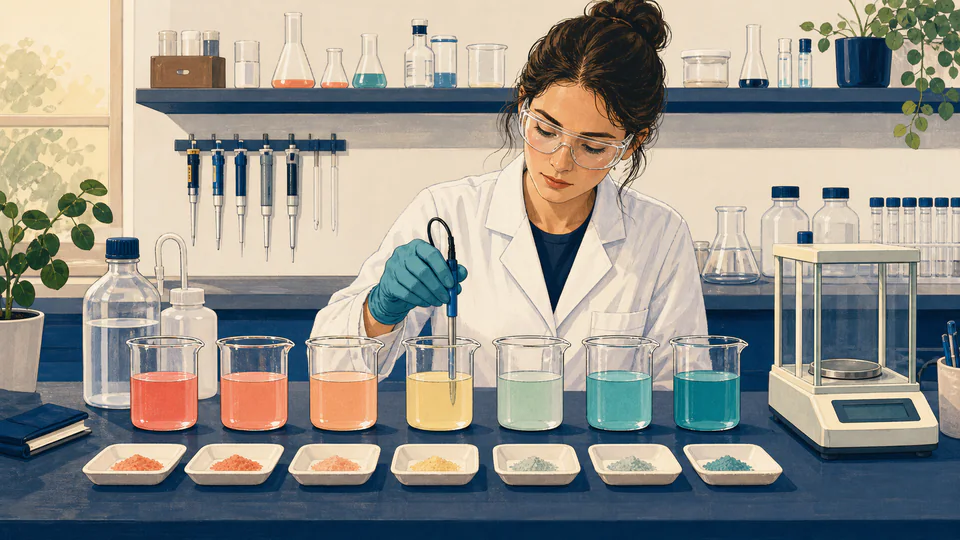
Targets 6.6 through 7.8 by 0.2 at 100 mM and 100 mL produce seven separate 10 mmol recipes. The table supports vessel labels and the curves reveal changing mass demand.
Chemistry and buffer design
Generate independent acid-form and base-form reagent recipes across a pH series at fixed total concentration and per-batch volume.
CURRENT-VALUE CALCULATOR
Each table row is an independent final-volume batch with the same analytical concentration and volume. The tool partitions its own buffer amount and reports bottle-specific, purity-corrected masses.
Decision supported: how to prepare a reproducible panel of buffer batches and how much total reagent is needed only if every listed row will be made.
LIVE CURRENT-VALUE ANALYSIS
Every plotted point is an exact table row. Acid-form mass falls and base-form mass rises as the target moves above pKa.
| Row | Target pH | A- / HA | HA mmol | A- mmol | HA reagent g | A- reagent g |
|---|
DETAILED CALCULATION PROCESS
For each pH_i: R_i=10^(pH_i-pKa); n_total=C_total V; n_HA,i=n_total/(1+R_i); n_A,i=n_total-n_HA,i; m_i=n_i M_i/purity_i.
The pH sequence is generated first. Each target is then solved independently at the same concentration and final volume; only the optional all-rows totals sum material across recipes.
| Symbol | Meaning | Unit | Default basis |
|---|---|---|---|
| pH_i | Target pH for recipe row i | pH | 6.6 to 7.8 |
| Delta pH | Increment between generated targets | pH | 0.2 |
| n_total | Buffer amount in each row | mmol | 10 mmol |
| R_i | Row-specific A-/HA ratio | dimensionless | Varies by pH |
| m_HA,i, m_A,i | Purity-corrected masses per row | g | Calculated |
| Sigma m | Reagent demand if all rows are made | g | Seven-row total |
HOW TO USE THIS CALCULATOR
BUFFER FOUNDATIONS
DEEP ANALYSIS 1
Fine steps increase experimental resolution but also increase vessels, handling time, reagent use, and multiple-comparison burden. Choose spacing from the expected response width, not aesthetic symmetry.
DEEP ANALYSIS 2
Far from pKa, one reagent amount shrinks exponentially. The live mass curves expose rows where balance readability or transfer loss can dominate the nominal amount.
DEEP ANALYSIS 3
A serial titration carries volume and material from one point to the next. Here each row independently reaches the same final concentration and volume, so totals and uncertainty propagate differently.
RESULT INTERPRETATION
Use each row for one batch. Use the top-level total reagent cards only for inventory planning when every generated recipe is prepared.
The crossing region near pKa has similar analytical moles of both forms, but gram curves cross elsewhere if molar masses or purities differ.
If an extreme row requests less material than the validated weighing minimum, use stock solutions or redesign the batch size rather than rounding aggressively.
REAL LAB DECISIONS
Targets 6.6 through 7.8 by 0.2 at 100 mM and 100 mL produce seven separate 10 mmol recipes. The table supports vessel labels and the curves reveal changing mass demand.
A 0.02 pH increment may create more than 25 rows, increase workload, and exceed this page limit. A coarser scouting panel followed by a focused second round is usually more defensible.
EVIDENCE AND DATA QUALITY
Retain panel purpose, pKa and temperature, start/end/step, row-count rule, fixed concentration and volume, exact reagent identities and assays, recipe export version, vessel IDs, actual masses, balance resolution, measured pH values, adjustment history, and deviations.
LIMITS AND EXCLUSIONS
TERMS USED HERE
RELIABLE SOURCES
FREQUENTLY ASKED QUESTIONS
No. Every row is an independent final-volume recipe.
If the interval is not an exact whole number of steps, the tool stops at the last complete increment rather than inventing a shorter step.
The limit keeps the output operationally reviewable and prompts reconsideration of overly dense screening plans.
That is a different preparation strategy with different dilution and adjustment calculations; this table assumes direct independent recipes.
At pKa the mole amounts are equal, but different molar masses or assays produce different gram amounts.
Increase batch size, use a validated stock solution, or narrow the pH range; do not silently round away the minor species.
IMPORTANT BOUNDARY
This table is a planning and traceability aid. Review balance capability, chemical compatibility, reagent identity, measured pH, and laboratory procedure before preparing the panel.