RE

Reliability

Component Failure Simulation Calculator

Run a seeded component-failure Monte Carlo model with an explicit common-cause branch.

MONTE CARLO SCENARIO

Expose the tail created by a shared failure mechanism

For reliability teams testing redundancy thresholds when independent component risk is not the whole story.

Threshold probability-
Mean failures-
Any failure-
P95 failure count-
Analytic mixture mean-

CURRENT DECISION RECORD

Seeded failure-count histogram

Every row is regenerated from the active inputs and carried into Copy, TXT, and the page-specific PDF payload.
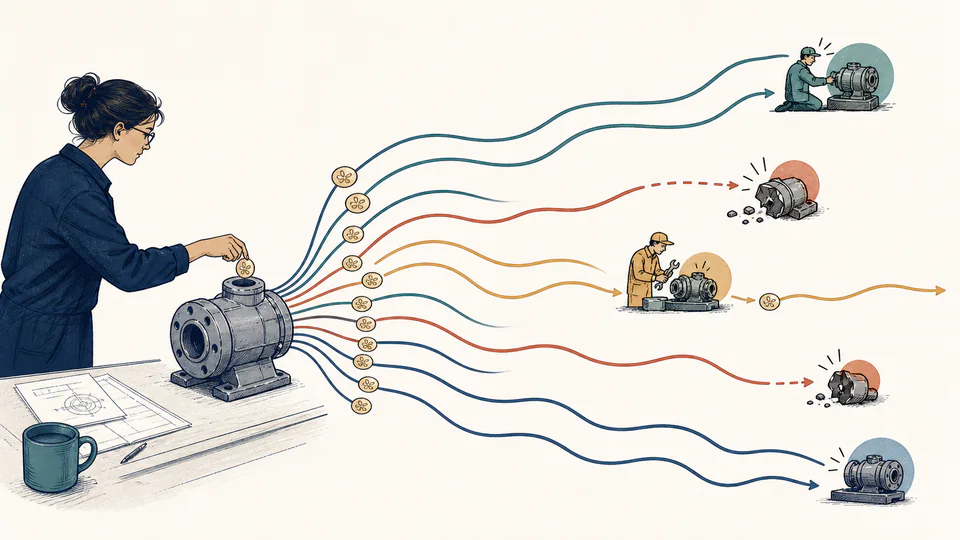
Editorial illustration of many components facing separate small hazards while one overhead cable represents a shared shock
Separate random faults and one shared shock create very different tail behavior.
Seeded failure-count histogramLive values; no fixed placeholder rows
Seeded failure-count histogram for the current entered model
Failed componentsSimulated trialsTrial share (%)

CURRENT CALCULATION PROCESS

Formula, substitution, intermediate values, and reconciliation

F = N with probability q; otherwise F ~ Binomial(N,p)

    Waiting for valid inputs.

    HOW TO USE

    Run a reproducible scenario

    1. Define the number of simultaneously exposed components.
    2. Enter independent per-component failure probability for one mission.
    3. Enter a separate common-cause probability for an all-component shock.
    4. Choose a decision threshold, iteration count, and recorded seed.
    5. Rerun with alternate seeds and compare simulation error with the analytic mean.

    FOUNDATIONS

    Simulation essentials

    Trial
    One complete component-group mission.
    Bernoulli event
    Each independent component either fails or survives.
    Common cause
    A shared event that fails the complete entered group in this simplified mixture.
    Seed
    A reproducibility key for the pseudo-random sequence.
    Monte Carlo error
    Finite-run variation that shrinks as iterations increase.

    DEEP ANALYSIS

    Why tails, checks, and thresholds matter

    Tail inflation

    A rare common-cause branch can dominate the probability of many simultaneous failures.

    Mean check

    The mixture mean N[q+(1-q)p] provides an independent deterministic check.

    Threshold choice

    Set it from the consequence or redundancy rule before looking at simulated results.

    CASES

    Independent and shared-shock behavior

    Independent electronics batch

    Low p and q=0 produces a familiar binomial-like histogram concentrated near zero.

    Common-cause boundary

    Even a small q places mass at all components failed and can sharply raise the threshold probability.

    TERMS

    Monte Carlo vocabulary

    Iteration
    One simulated mission.
    Histogram
    Counts of trials by failed-component total.
    P95
    The 95th percentile failure count.
    Mixture model
    A model combining common-cause and independent branches.
    Threshold exceedance
    Failure count at or above the entered limit.
    Pseudo-random
    Deterministic numbers that emulate random draws from a seed.

    EVIDENCE RECORD

    Inputs and lineage to preserve

    Archive component count, independent probability, common-cause probability, threshold, iterations, seed, model revision, and alternate-seed results. Preserve the engineering basis for p and q separately so reviewers can reproduce the mixture and challenge the shared-shock assumption.

    MODEL LIMITS

    Where the seeded mixture stops

    • Common-cause branch fails every entered component.
    • Independent branch uses identical constant probabilities.
    • No repair, time ordering, load sharing, or cascading failure.
    • Simulation output is seed- and iteration-dependent.

    SOURCES

    Probability and reliability references

    FAQ

    Simulation-specific questions

    Is the seed random?

    It initializes a deterministic xorshift32 stream so the same inputs reproduce the same table.

    Why not use only the analytic binomial?

    The common-cause branch changes the tail and simulation makes that mixed outcome tangible.

    Does q overlap p?

    The model applies q first; independent failures run only when the common-cause event does not occur.

    How many iterations are enough?

    Enough depends on the tail probability and precision needed; compare seeds and report Monte Carlo uncertainty.

    Can partial common-cause failures be modeled?

    Not here; this page uses an explicit all-component shock branch.

    Is P95 a worst case?

    No. Five percent of simulated trials can be at or above it, subject to ties.

    IMPORTANT SIMULATION NOTE

    A common-cause branch must come from engineering evidence

    The seeded result illustrates the entered mixture. It does not establish the true shared-shock probability, independence of the remaining component failures, or safety of the threshold.