PR

Probability

Decision Tree Odds Calculator

Combine two mutually exclusive branches and branch-conditional success rates into total success probability and odds for and against success.

DECISION-TREE ODDS

Aggregate path probabilities before quoting success odds

This calculator evaluates a two-branch chance tree in which branch A or B occurs first and each branch has its own conditional success probability. Program managers and decision analysts can use it to reconcile total success odds, while keeping branch selection and conditional performance as separate evidence.

Total success probability-
Odds for success-
Odds against success-
Total failure probability-
A-success path contribution-
B-success path contribution-

DECISION-TREE ODDS

Four-leaf path-probability ledger

Use the two path contributions to identify which branch drives overall success and whether a change to branch selection or branch performance would materially alter the odds.

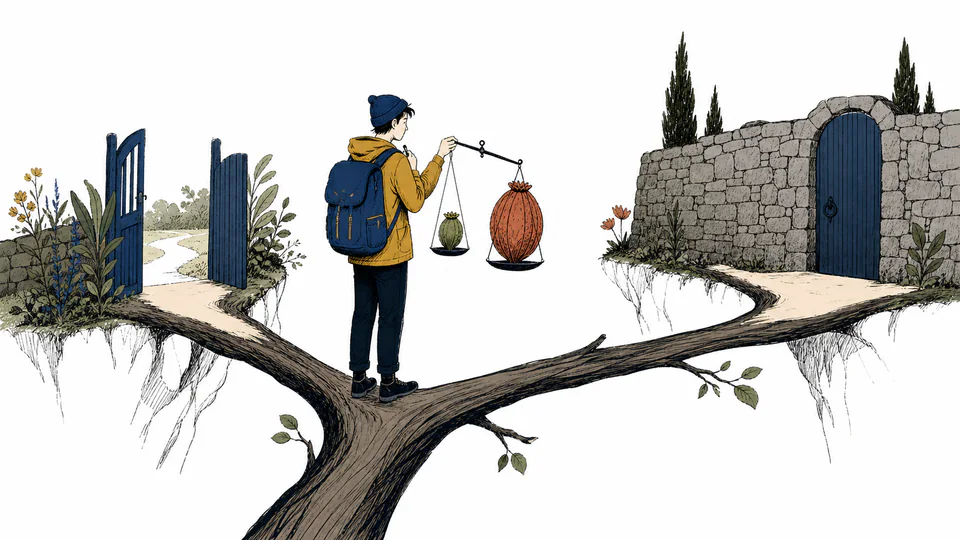
Editorial illustration of one decision fork splitting into four terminal paths with two success markers
Overall success is the sum of the two complete success paths, not an average of the conditional success rates.
Four-leaf path-probability ledgerCurrent unrounded calculation path
Live detail from current inputs
Terminal pathPath probability (%)PayoffProbability x payoffPayoff state

CURRENT CALCULATION PROCESS

Formula, substitution, intermediate values, and reconciliation

P(S) = P(A)P(S|A) + [1 - P(A)]P(S|B); odds for S = P(S)/[1 - P(S)]

The tree first creates the mutually exclusive A and B branch weights. Each weight is multiplied by its own conditional success or failure rate to produce four terminal path probabilities. The two success paths are added, then probability is converted to odds only after aggregation.

    HOW TO USE THIS MODEL

    Build odds from conditional evidence rather than blended rates

    1. Define branches A and B so they are mutually exclusive and collectively exhaustive for the decision horizon.
    2. Enter the observed or forecast share entering branch A; the calculator assigns the complement to B.
    3. Enter success rates measured conditionally within each branch, using the same success definition and follow-up window.
    4. Review A-success and B-success contributions before the total, because the same total odds can conceal very different path structures.
    5. Use the odds ratio only for communication or downstream odds calculations; retain the probability and path ledger as the auditable basis.

    DECISION-TREE ODDS FUNDAMENTALS

    The conditional structure behind tree odds

    Mutually exclusive branches
    Each case must enter either A or B, not both, so their initial probabilities sum to one.
    Conditional success
    P(S|A) describes success among A cases and cannot be applied directly to the B population.
    Path probability
    A terminal path probability is the product of sequential conditional probabilities along that path.
    Law of total probability
    When branches partition the population, total success is the sum of branch-weighted conditional success probabilities.
    Odds and probability
    Odds for success are p/(1-p); they are not the same numerical scale as p percent and become unbounded as p approaches one.

    MODEL AND FORMULA

    Why complete-path multiplication must precede addition

    P(S) = P(A)P(S|A) + [1 - P(A)]P(S|B); odds for S = P(S)/[1 - P(S)]

    The tree first creates the mutually exclusive A and B branch weights. Each weight is multiplied by its own conditional success or failure rate to produce four terminal path probabilities. The two success paths are added, then probability is converted to odds only after aggregation.

    DEEPER ANALYSIS

    Design checks before comparing or changing the odds

    Branch mix can move the total without changing performance

    A shift toward the branch with the higher conditional success rate raises overall success even if neither branch improves. Track mix and conditional rates separately to avoid attributing a composition change to better execution.

    Success definitions must be invariant

    If branch A counts success at 30 days while branch B counts it at 90 days, the total is not a coherent probability. Align outcome definition, censoring rule, and observation window before combining evidence.

    Odds are useful but easy to miscommunicate

    Odds of 1.5 mean 1.5 successes per failure in the long run, corresponding to 60% probability. Reporting 1.5 as "150% likely" is incorrect.

    WORKED DECISION CASES

    Two branch decisions that require different interventions

    Routing policy review

    Sixty percent of cases take A and succeed 80% of the time; the remaining 40% take B and succeed 30% of the time. A contributes 48 percentage points and B contributes 12, for 60% total success and odds of 1.5 to 1. The ledger shows that improving B may matter less than expected unless its routing share also changes.

    Observed mix shift

    A service team sees total success rise after more cases qualify for its strong A pathway, while both conditional rates stay unchanged. The tree correctly attributes the movement to routing composition; a simple before-and-after total would wrongly imply that every pathway improved.

    TECHNICAL LANGUAGE

    Decision-tree odds terminology

    Chance node
    A point where mutually exclusive outcomes occur with assigned probabilities rather than a controllable choice.
    Conditional probability
    The probability of an outcome given that a specified earlier branch occurred.
    Terminal leaf
    A complete path ending in a defined outcome such as success or failure.
    Path contribution
    The terminal path probability's contribution to an aggregated event probability.
    Odds for
    The ratio of event probability to non-event probability.
    Odds against
    The reciprocal ratio: non-event probability divided by event probability.

    EVIDENCE AND DATA LINEAGE

    Preserve branch assignment and conditional-outcome lineage

    Retain the rule that assigns cases to A or B, raw branch counts, branch-specific successes and failures, outcome window, censoring treatment, missing follow-up, and any modeled rather than observed inputs. Confirm that every eligible case appears once and that branch selection is not reconstructed using information available only after the outcome.

    LIMITS AND EXCLUSIONS

    What the two-branch odds model excludes

    • It assumes A and B form a complete, non-overlapping partition and that each conditional probability applies to the decision population.
    • It does not infer causal benefit from selecting A; branch assignment may reflect case difficulty or other confounding factors.
    • It does not quantify sampling uncertainty, parameter dependence, time-varying rates, or more than two initial branches.
    • Payoffs shown in the ledger do not influence success odds; use expected-value or risk analysis when economic consequences drive the decision.

    RELIABLE SOURCES

    References for this model and its decision limits

    FREQUENTLY ASKED QUESTIONS

    Questions about branch-weighted success odds

    Why not average the two success rates?

    An unweighted average assumes equal branch shares. Total success must weight each conditional rate by the probability of reaching that branch.

    Do the payoff fields affect the odds?

    No. They preserve a common four-leaf scenario for other tree analyses. This page classifies success by leaf and calculates odds from path probabilities only.

    Can branch A probability be 0% or 100%?

    The base model permits an endpoint branch mix. The unused branch then contributes zero path probability, but its conditional input no longer affects the total.

    What happens at 100% total success?

    Failure probability becomes zero and odds for success are mathematically infinite. Report the probability and the finite evidence behind it rather than presenting an arbitrary large odds value.

    Can I interpret higher A success as proof that routing cases to A causes success?

    No. Observational branch differences may be caused by selection, eligibility, severity, or timing. Causal claims require an appropriate design beyond this probability reconciliation.

    When should I use a larger tree?

    Use an expanded model when branches are not exhaustive, downstream states matter, repeated decisions occur, or consequences depend on more than the four represented leaves.

    IMPORTANT NOTE

    Odds summarize the declared tree; they do not validate it

    This page performs exact conditional-probability arithmetic for the entered two-branch structure. It does not establish causal effects, estimate parameter uncertainty, or replace decision governance, validation data, or a more complete event tree when material pathways are omitted.