PR

Probability

Lottery Outcome Table Calculator

Build the complete hypergeometric match-count table for a finite lottery draw.

FINITE OUTCOME DISTRIBUTION

Account for every possible match count before discussing a winning threshold

For lottery analysts, educators, and pool organizers who need a reproducible hypergeometric table rather than a single headline odds figure.

Per-ticket qualifying chance-
At least one qualifying ticket-
Expected matches per ticket-
Expected qualifying tickets-
Batch spend-

CURRENT DECISION RECORD

Complete match-count outcome table

Every row is regenerated from the active inputs and carried into Copy, TXT, and the page-specific PDF payload.
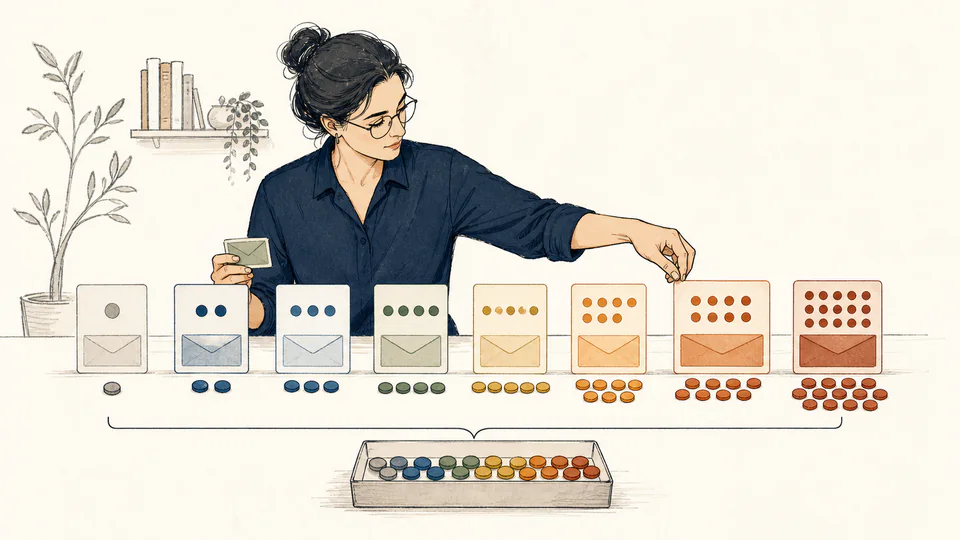
Editorial illustration of numbered balls sorting into separate match-count trays while an analyst checks the complete set
Every valid ticket belongs to one-and only one-match-count compartment.
Complete match-count outcome tableLive values; no fixed placeholder rows
Complete match-count outcome table for the current entered model
MatchesCombinationsProbability (%)Expected tickets

CURRENT CALCULATION PROCESS

Formula, substitution, intermediate values, and reconciliation

P(X=k) = C(K,k)C(N-K,n-k) / C(N,n)

    Waiting for valid inputs.

    HOW TO USE

    Build the complete outcome partition

    1. Enter the total number pool and how many winning numbers are drawn without replacement.
    2. Enter how many distinct numbers appear on one ticket; this may differ from the draw count in custom games.
    3. Set the first match count that qualifies for the outcome you are studying.
    4. Enter the number and cost of tickets to translate per-ticket probabilities into expected row counts and spend.
    5. Inspect every match row before using the qualifying total; the table is the audit trail for the sum.

    FOUNDATIONS

    Five ideas behind the table

    Hypergeometric model
    Matches are counted when a sample is drawn without replacement from a finite pool.
    Outcome partition
    Every possible ticket falls into exactly one match-count row, so row probabilities must sum to one.
    Combinations
    C(n,k) counts unordered selections; lottery order is ignored unless the game explicitly awards ordered outcomes.
    Expected row count
    Tickets x row probability is a long-run average, not a guaranteed number of tickets in that row.
    Qualifying tail
    The entered minimum match combines all rows at or above that threshold.

    DEEP ANALYSIS

    Read support, tails, and batches separately

    Unequal draw and pick sizes

    The support starts at max(0, picks - non-winning numbers) and ends at min(picks, drawn). Impossible rows are excluded rather than displayed as fake zeros.

    One-ticket table versus batch chance

    The table describes one ticket. The at-least-one qualifying result across many tickets uses a second complement calculation and assumes independent tickets.

    Why payout is absent

    Prize schedules can split tiers, add bonus balls, cap pools, or share jackpots. This page stays authoritative by modeling match counts only.

    DECISION CASES

    Standard and constrained supports

    Six from 49

    A 6-number ticket against six drawn numbers from 49 produces seven match rows from zero through six. Their probability sum and expected-match identity independently check the table.

    Forced matches in a small pool

    If 8 numbers are picked from a 10-number pool while 6 are drawn, at least four matches are unavoidable. Rows below four are mathematically impossible and omitted.

    TERMS

    Outcome-table vocabulary

    Population
    All distinct numbers eligible for the draw.
    Success states
    The drawn winning numbers within the population.
    Sample
    Numbers selected on one ticket.
    Support
    The complete set of possible match counts.
    Combination
    An unordered selection count.
    Tail probability
    The sum of probabilities at or above a stated threshold.

    EVIDENCE RECORD

    Inputs and lineage to preserve

    Retain the pool size, draw count, ticket-pick count, qualifying threshold, ticket batch definition, rules edition, draw date, and official game-rules URL. A changed bonus-ball or ordered-draw rule creates a different sample space and requires a new table.

    MODEL LIMITS

    Where the match-count model stops

    • Assumes unordered, distinct numbers drawn without replacement.
    • Does not model bonus balls, ordered draws, multipliers, prize sharing, taxes, or rollovers.
    • Batch at-least-one probability assumes ticket outcomes can be treated as independent.
    • Large combination counts are evaluated in logarithmic space and displayed with practical rounding.

    RELIABLE SOURCES

    Combinatorics and official game context

    FAQ

    Questions specific to match tables

    Does this include a bonus ball?

    Not as a separate state. Model the main draw only unless the bonus ball is part of the same undifferentiated set.

    Why are some match rows missing?

    They are outside the feasible support given the pool, draw size, and ticket picks, so their probability is exactly zero.

    Can repeated numbers be modeled?

    No. The hypergeometric model assumes distinct selections without replacement.

    Is expected qualifying tickets a forecast?

    No. It is the average over many equivalent batches; an actual batch can contain none or several.

    Do identical tickets count as independent?

    No for diversity of selections. The batch complement assumes independent ticket outcomes and should not be used for literal duplicate tickets.

    Can I add prize amounts?

    Use a separate expected-value model with the official tier rules. Match probability alone is insufficient for payout value.

    IMPORTANT NOTE

    A match distribution is not a prize schedule

    Verify bonus-ball logic, prize tiers, and duplicate-ticket dependence separately before using these probabilities in a financial analysis.