A basic calculator can make do with a handful of dark bars. A graphing calculator has to draw a curve that passes through places no designer could predict. That single change turns the screen from a fixed alphabet into a small addressable map.
The device is no longer showing only answers. It is showing relationships between values.
A curve is not a special digit
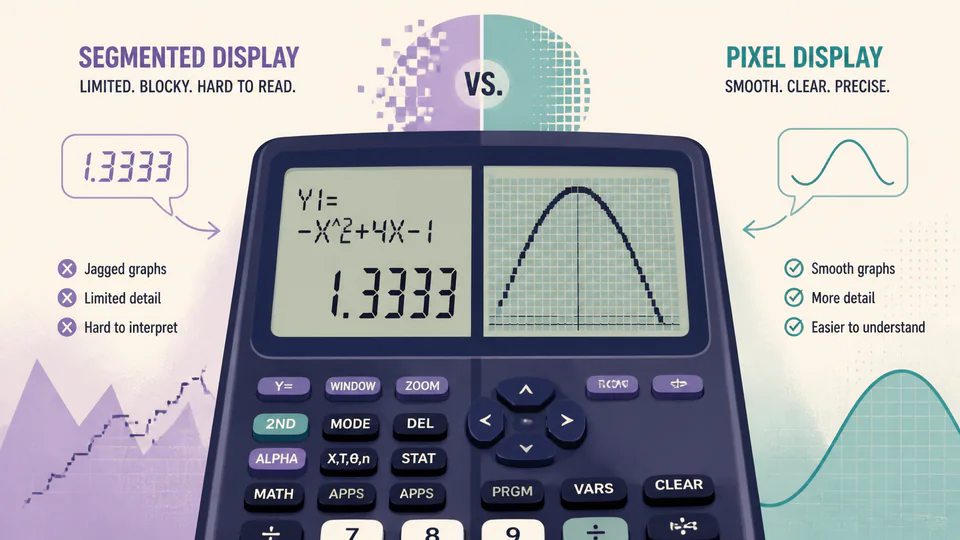
Seven-segment displays work because the shapes are known in advance. A graph can bend, cross an axis, or move through a new window chosen by the user. The screen needs many individually addressable locations so the calculator can light the pixels that approximate the plotted path.
TI documents graphing calculator screens in pixels and lines, a useful clue to the interface’s fundamental unit. The curve is not a stored icon; it is a set of screen positions calculated from an equation and a viewing window.
Pixels become a sampled curve
The calculator evaluates the function at selected x positions, maps the resulting y values into screen coordinates, and connects or marks those locations. Zooming changes the mapping. A curve that looks smooth at one scale can reveal its pixel decisions at another.
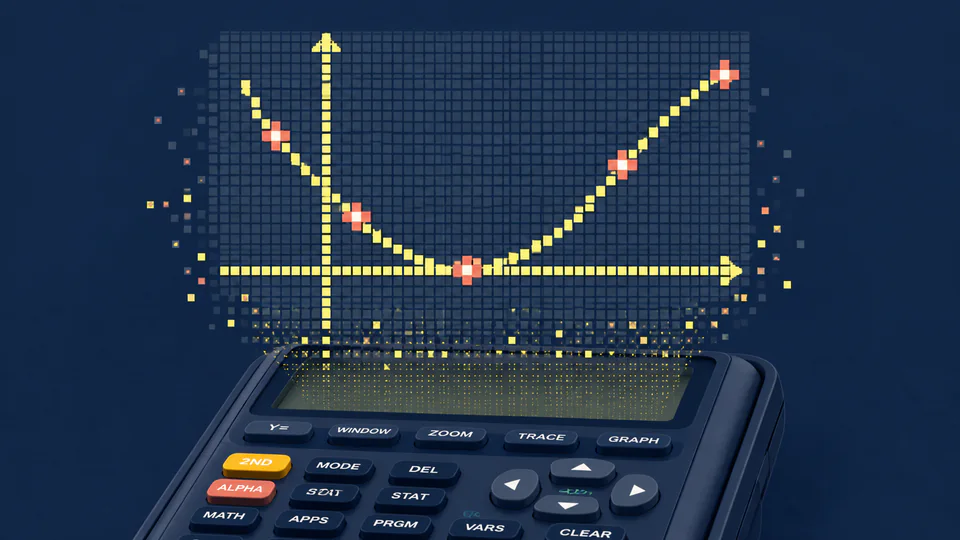
The pixel grid also allows axes, labels, tables, and plotted points. These are not just extra decorations around the graph; they are additional layers of spatial information.
The screen demands more memory around it
A graphing calculator needs to remember equations, window settings, lists, tables, and perhaps multiple plots. The screen is only the visible end of a larger state model. That is why graphing calculators feel more like small computers than like larger four-function calculators.
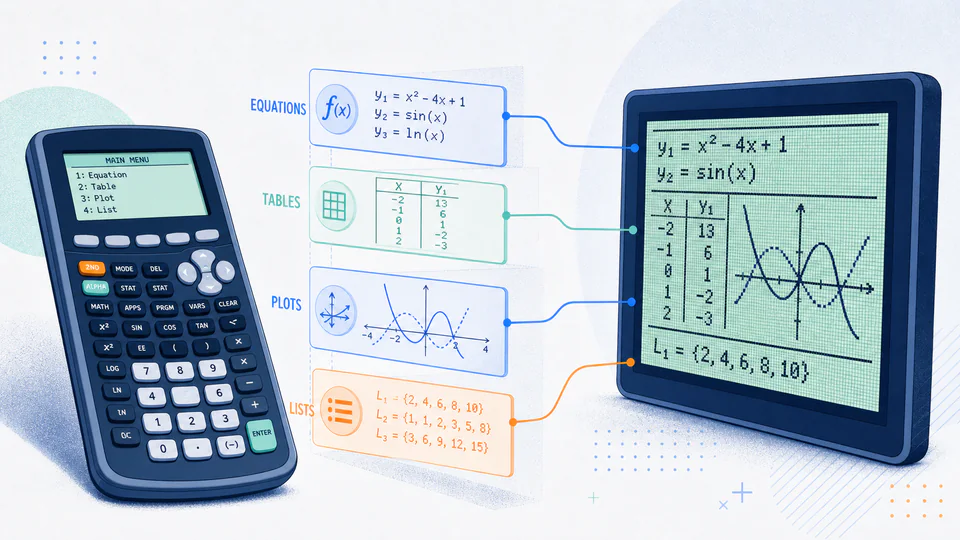
A graphing calculator is a calculator that learned the answer can have a shape.