Enter 12, 15, 17, and 20 into a statistics calculator and it can later tell you the mean and standard deviation. The machine does not need to display the whole list while it works. It can reduce the incoming data to a handful of summaries that are sufficient for the requested calculation.
That reduction is not the same as remembering everything. It is more like keeping a well-chosen receipt.
The first summary is a count
The calculator needs to know how many observations have arrived. It also needs their total. For a mean, those two values are enough: total divided by count.
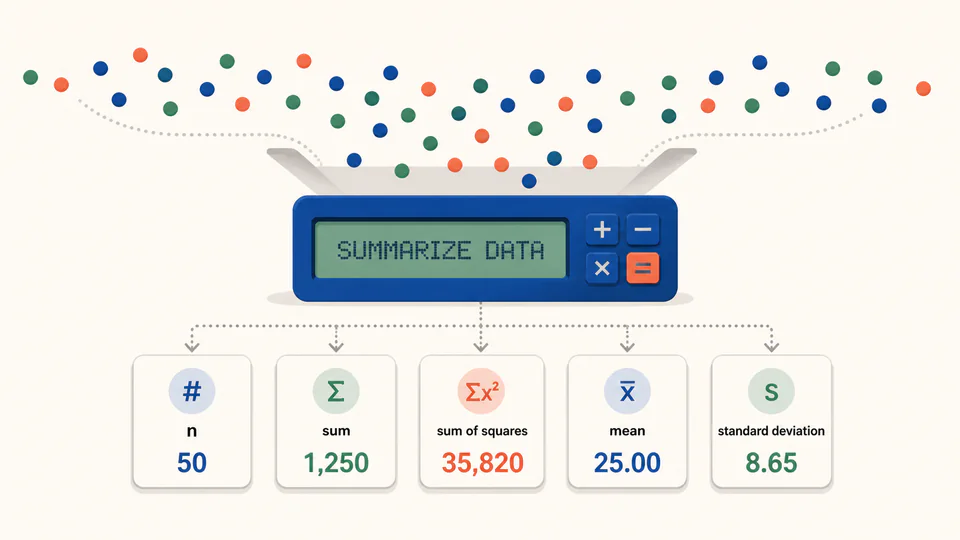
For variance and standard deviation, the machine needs more information about spread. A traditional summary set includes the sum of the values and the sum of their squares, along with the count. Modern implementations may use numerically safer running formulas, but the design question is the same: which summaries preserve the information needed later?
Casio’s statistics documentation exposes values such as n, sum of x, sum of x squared, mean, population standard deviation, and sample standard deviation as distinct results.
It can update the ledger while you type
The machine does not have to wait until the final value before doing useful work. Each new observation can update the count and running totals. The screen may show only the latest entry, but the statistical memory is changing underneath.
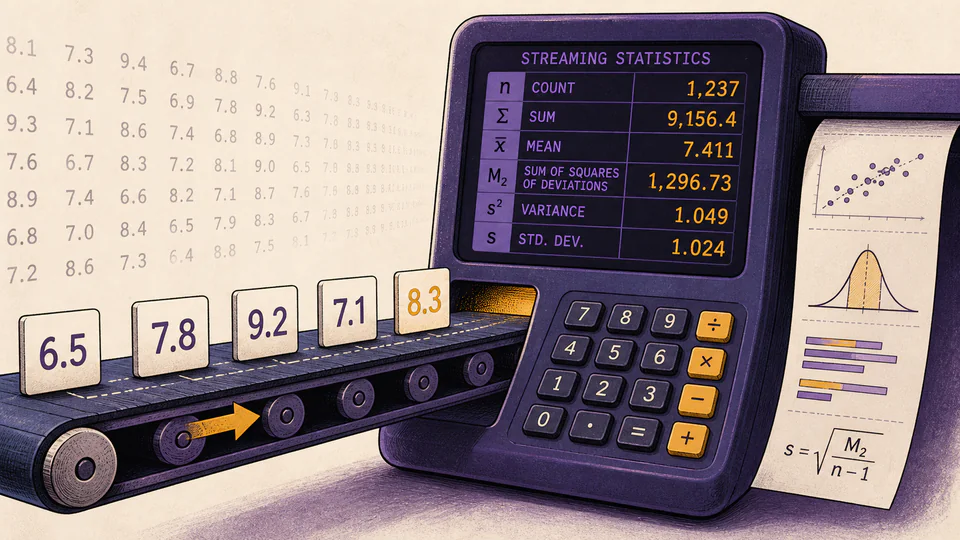
This is why clearing statistical memory matters. A new data set added to an old ledger is not a new experiment. It is a mixture of two streams that happen to share a screen.
Standard deviation measures distance from the center
The mean tells you where the center is. Standard deviation describes how widely the observations spread around it. A tight cluster has a shorter spread; a dispersed group has a longer one.
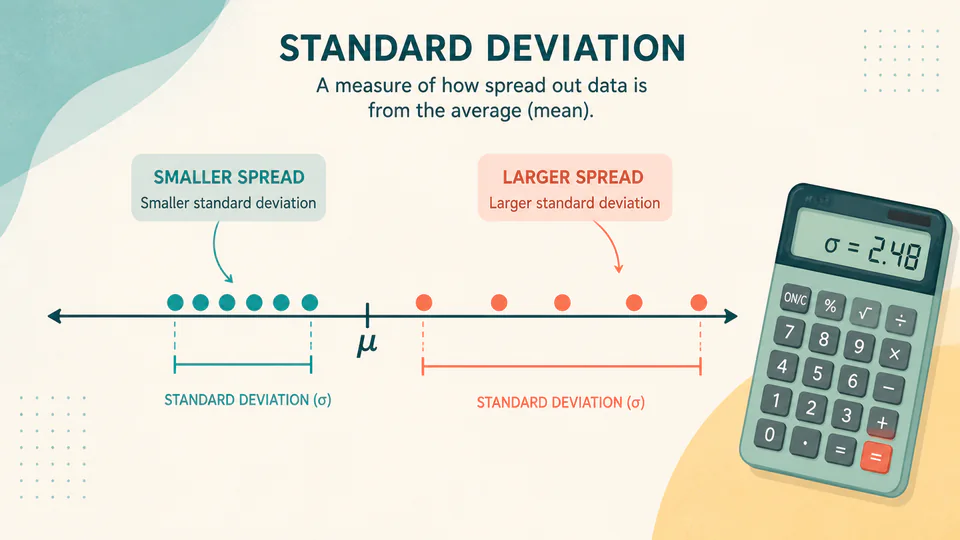
The calculator still needs a convention about whether the data are being treated as the whole population or as a sample. Those are different denominators and therefore different results. The answer is not wrong because it changed; the question changed.
A statistics calculator is a small machine for forgetting the list without forgetting the structure the list created.