Rooms outpace enrollment
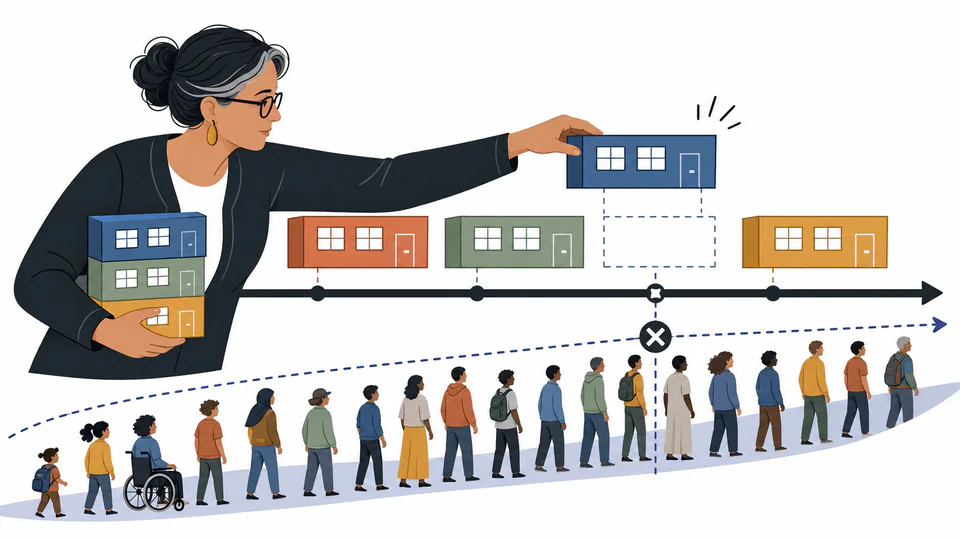
One room arrives each term while enrollment adds fewer students. The final headroom grows, but the project still needs commissioning evidence for each opening.
Education
A capacity plan can look adequate today and fail later as enrollment grows. This term-indexed model keeps new rooms, seat supply, reserve policy, and enrollment growth on the same timeline.
TERM CAPACITY SCHEDULE
A capacity plan can look adequate today and fail later as enrollment grows. This term-indexed model keeps new rooms, seat supply, reserve policy, and enrollment growth on the same timeline.
LIVE CAPACITY / SCORE VISUAL
A capacity plan can look adequate today and fail later as enrollment grows. This term-indexed model keeps new rooms, seat supply, reserve policy, and enrollment growth on the same timeline. The visual updates from the same validated calculation record; it is an interpretation aid, not a policy or compliance ruling.
| Term | Classrooms | Usable seats | Enrollment | Headroom | Utilization / state |
|---|
How to use
Schedule fundamentals
Calculation method
For each term, rooms increase by the entered room addition and enrollment increases by the entered growth. Usable seats equal rooms times seats per room after reserve. The page keeps each period’s exact row so the crossing point is visible rather than hidden in a final average.
Growth assumptions
Constant term growth is useful for a first planning pass. It can mislead when intake is cohort-based, when rooms open in batches, or when a new programme changes the enrollment curve.
Timing boundary
The model uses ordered terms and does not invent start dates, holidays, construction lead time, or commissioning delays. Add those in the project schedule that governs the programme.
Visual reading
The live chart plots usable seats and enrollment for every term. The intersection is a planning warning; it does not explain why a room is unavailable or whether a staffing constraint arrives earlier.
Detailed calculation process
The current term rows above provide the final reconciliation.
Result interpretation
If no shortfall appears, the result means only that the entered linear scenario stays within usable seats. If a shortfall appears, its first term is the earliest modeled breach; later rows show how it grows.
Decision response
When rooms are fixed but enrollment growth is uncertain, test growth. When intake is known but room delivery is staged, test room additions. Keep the changed assumption named in the report.
Limits and exclusions
Key terminology
Worked decision cases
One room arrives each term while enrollment adds fewer students. The final headroom grows, but the project still needs commissioning evidence for each opening.
Stable room supply with rapid intake creates an early line crossing. A later target row cannot excuse the first operational shortfall.
Authoritative basis
Term projections are scenario arithmetic. Use the district’s approved enrollment forecast, room programme, and calendar for formal planning.
It is the starting state before modeled changes begin.
This model uses a constant addition; vary the input in separate scenarios.
A consistent policy makes the trend comparable across rows.
No, it gives an indexed planning period only.
No; use a separate declining-enrollment model for that case.