Teaching a piston experiment
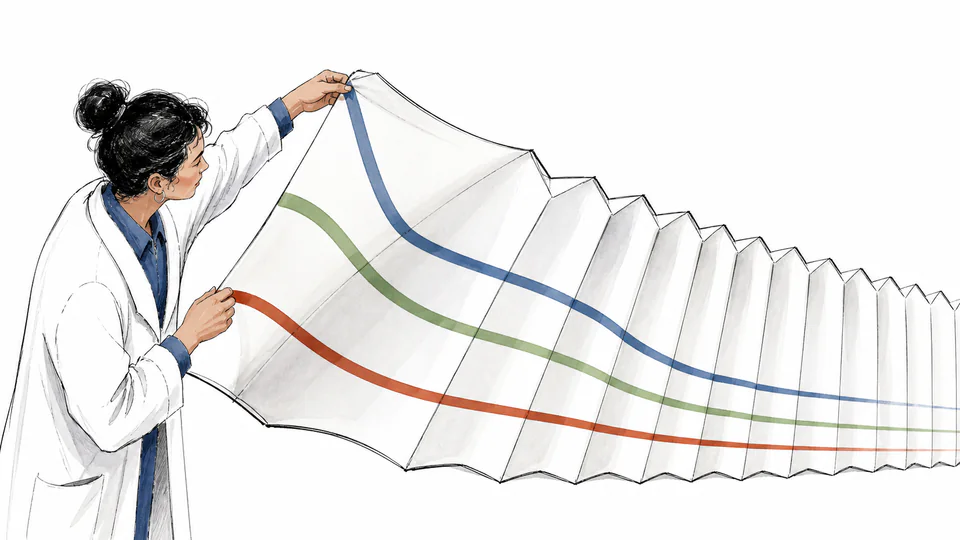
Students compare 240, 300 and 360 K curves for 1.5 mol and see why the same 25 L volume supports different pressures.
Physics and thermodynamics
Plot three ideal-gas pressure-volume isotherms and calculate reference pressure, local slope, endpoint ratio, and reversible isothermal work.
Ideal gas isotherm graph
This page builds three equilibrium P-V curves around a chosen temperature. It quantifies the local slope at one reference volume and the reversible work under the center isotherm.
Current model evidence
The table and plot use the same nine volume samples and unrounded state model.
| Volume (L) | Low-T pressure (kPa) | Center-T pressure (kPa) | High-T pressure (kPa) | Amount (mol) |
|---|
DETAILED CALCULATION PROCESS
P(V,T) = nRT/V; dP/dV = -nRT/V²; Wrev = nRT ln(Vmax/Vmin)
Using kPa and liters is numerically compatible with R in J/(mol K), because 1 kPa L equals 1 joule.
| Symbol | Meaning | Unit | Default basis |
|---|---|---|---|
| n | Fixed gas amount | mol | 1.5 |
| Tlow, Tc, Thigh | Three absolute temperatures | K | 240, 300, 360 |
| V | Gas volume | L | 10 to 60 |
| Vref | Slope reference volume | L | 25 |
| P | Equilibrium absolute pressure | kPa | calculated |
| Wrev | Reversible isothermal expansion work | J | calculated |
HOW TO USE THIS CALCULATOR
IDEAL-GAS BASICS FOR THIS MODEL
DEEP ANALYSIS 1
Points on an isotherm are equilibrium states. The graph does not say how quickly a piston moves or how heat is supplied.
DEEP ANALYSIS 2
Because slope scales with 1/V², small-volume uncertainty can dominate a local stiffness interpretation.
DEEP ANALYSIS 3
The logarithmic work assumes quasistatic expansion with the center temperature maintained; irreversible work can differ.
RESULT INTERPRETATION
Use vertical separation to compare thermal pressure at the same volume and horizontal movement to inspect compression or expansion at one temperature.
The endpoint ratio is a Boyle-law check; the local slope is not an average slope across the full range.
REAL USE CASES
Students compare 240, 300 and 360 K curves for 1.5 mol and see why the same 25 L volume supports different pressures.
A thermodynamics exercise uses the center curve between 10 and 60 L; the logarithmic area provides reversible isothermal work, not compressor electricity.
EVIDENCE AND DATA QUALITY
Record the amount basis, whether pressure data are absolute, the temperature uncertainty, volume calibration, chosen graph bounds, and whether a real experiment was slow enough to approximate equilibrium.
LIMITS AND EXCLUSIONS
TERMS USED HERE
RELIABLE SOURCES
FREQUENTLY ASKED QUESTIONS
P is proportional to 1/V, producing a hyperbola.
At the same n and V, pressure is proportional to kelvin temperature.
No. That would place the low isotherm at or below absolute zero.
It can describe local pressure sensitivity, but mechanical force also depends on piston area and system geometry.
No. It is reversible boundary work for the center isotherm only.
No. The ideal-gas relation requires absolute pressure.
IMPORTANT BOUNDARY
The graph is an educational equilibrium model, not a compressor map, piston design, or real-gas property chart.