Nitrogen vessel charging
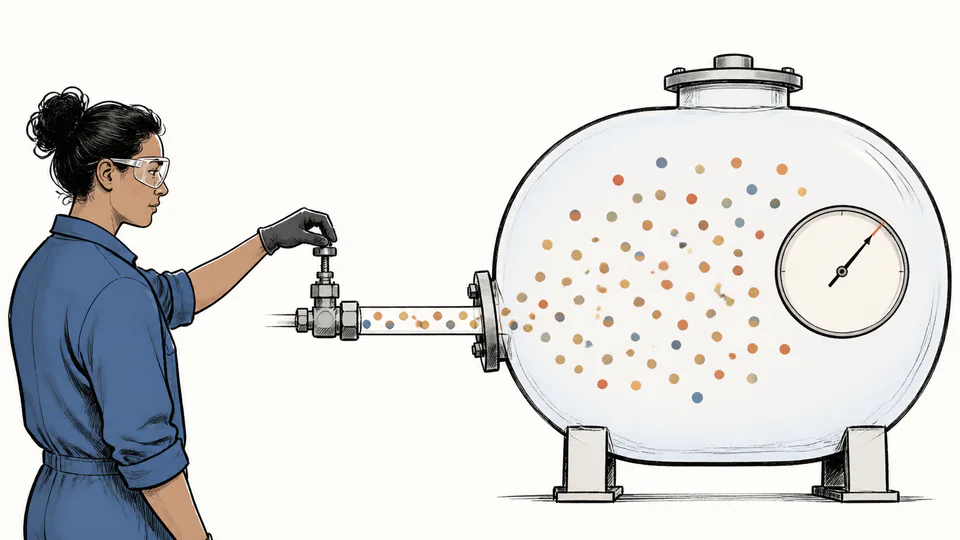
A lab charges a 0.5 m³ receiver from 101.325 to 250 kPa at 293.15 K in ten minutes. The ledger shows the additional moles and converts them using nitrogen molar mass if selected.
Physics and thermodynamics
Calculate the average net molar and mass transfer rate needed to move a rigid isothermal vessel between two absolute pressures.
Ideal gas inventory rate
This model converts two equilibrium vessel states into a signed average inventory rate. It answers how much gas must enter or leave, not whether a valve, regulator, or compressor can deliver that flow.
Current model evidence
Trace the two gas inventories before dividing their difference by elapsed time.
| Stage | Pressure or rate | Temperature (K) | Volume (m³) | Amount or rate | Change or mass rate |
|---|
DETAILED CALCULATION PROCESS
n = PV/(RT); n_dot = [V(P1 - P0)/(RT)] / Delta t; m_dot = n_dot M
The same rigid volume and temperature apply to both states. Subtracting their ideal-gas inventories isolates the net amount that must cross the boundary.
| Symbol | Meaning | Unit | Default basis |
|---|---|---|---|
| P0, P1 | Initial and target absolute pressure | Pa | 101.325 and 250 kPa |
| V | Rigid vessel volume | m³ | 0.5 m³ |
| T | Uniform absolute temperature | K | 293.15 K |
| R | Molar gas constant | J/(mol K) | 8.31446261815324 |
| Delta t | Transfer duration | s | 600 s |
| M | Molar mass | g/mol | 28.97 g/mol |
| n_dot | Signed average molar rate | mol/s | calculated |
HOW TO USE THIS CALCULATOR
IDEAL-GAS BASICS FOR THIS MODEL
DEEP ANALYSIS 1
In a sealed rigid vessel, warming raises pressure without adding moles. Use measured state temperatures when the process is not isothermal.
DEEP ANALYSIS 2
The required mole change is fixed by P, V, and T. Gas composition enters when converting that amount to grams or kilograms.
DEEP ANALYSIS 3
Line pressure drop, regulator capacity, compressor curves, sonic choking, and heat transfer determine whether the target can be achieved.
RESULT INTERPRETATION
Compare the pressure and inventory rates with the intended direction. A target below the initial pressure should produce negative values.
Treat the result as a mass-balance requirement. Add contingency only after separately evaluating leakage, purge losses, and delivery-system dynamics.
REAL USE CASES
A lab charges a 0.5 m³ receiver from 101.325 to 250 kPa at 293.15 K in ten minutes. The ledger shows the additional moles and converts them using nitrogen molar mass if selected.
A sampling vessel is reduced from 500 to 120 kPa. The negative molar rate quantifies net withdrawal; it does not predict vent noise, icing, or relief-device capacity.
EVIDENCE AND DATA QUALITY
Retain pressure calibration records, whether readings are absolute or gauge, vessel free-volume documentation, temperature location and averaging method, gas composition, and timestamps. Those facts define the reproducibility of the rate.
LIMITS AND EXCLUSIONS
TERMS USED HERE
RELIABLE SOURCES
FREQUENTLY ASKED QUESTIONS
No. Add the local atmospheric pressure first so both state pressures are absolute.
A lower target inventory requires net gas withdrawal; the sign preserves that direction.
Only if the final measured inventory already reflects them. The model itself is an endpoint balance.
Not necessarily. It is the constant average that would deliver the same net amount over the chosen duration.
Use a transient energy-and-mass balance or measured endpoint temperatures; the isothermal model would attribute thermal pressure rise to added gas.
No. Those require flow coefficients, upstream/downstream states, choking and safety-code criteria.
IMPORTANT BOUNDARY
This educational inventory estimate is not a pressure-system design, operating procedure, or safety certification.