Zero wins are still informative
With x = 0, Wilson produces a zero lower bound and a positive upper bound. The data constrain the rate but cannot prove the true probability is zero.
Probability
Calculate a Wilson confidence interval for an observed lottery win rate, compare wins with declared probability, estimate at-least-one-win probability, and separate sampling uncertainty from expected payoff.
REPEATED-DRAW UNCERTAINTY
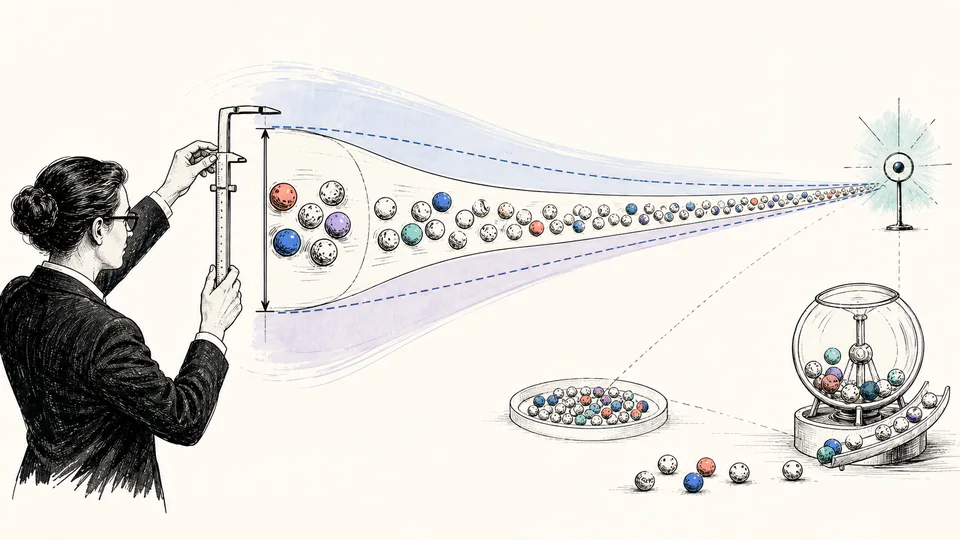
This calculator treats each recorded ticket as a Bernoulli trial, builds a Wilson score interval around the observed winning proportion, and compares the count with a declared per-ticket probability. It is designed for audit and simulation review—not for claiming that recent wins change future draw odds.
REPEATED-DRAW UNCERTAINTY
Use the interval to describe the precision of an observed or simulated win rate. Compare it with the declared probability only when every trial shares the same game, prize definition, and sampling process. Apparent disagreement can reflect sampling noise, data selection, dependence, or a mismatched win definition.
| Diagnostic | Observed or declared input | Scale term | Calculated value | Unit / meaning |
|---|
CURRENT CALCULATION PROCESS
p̂ = x/n; Wilson = [p̂ + z²/(2n) ± z√(p̂(1−p̂)/n + z²/(4n²))] / [1 + z²/n]
x is the recorded win count, n is the number of comparable tickets, z is the two-sided normal critical value for the selected confidence level, and p̂ is the observed proportion. A separate binomial expectation np0 uses the declared probability p0; the Wilson interval does not replace an exact game-odds calculation.
Intermediate values remain unrounded until display formatting.
HOW TO USE THIS MODEL
REPEATED-DRAW UNCERTAINTY FUNDAMENTALS
MODEL AND FORMULA
x is the recorded win count, n is the number of comparable tickets, z is the two-sided normal critical value for the selected confidence level, and p̂ is the observed proportion. A separate binomial expectation np0 uses the declared probability p0; the Wilson interval does not replace an exact game-odds calculation.
DEEP PROBABILITY ANALYSIS
With x = 0, Wilson produces a zero lower bound and a positive upper bound. The data constrain the rate but cannot prove the true probability is zero.
When the declared probability is tiny, thousands of trials may still yield no events. Large relative uncertainty is a property of the evidence, not a formatting problem.
Recording only sessions with wins, mixing free plays with paid tickets, or stopping after a success changes the sample. A narrow interval cannot repair biased collection.
WORKED DECISION CASES
Run a fixed number of simulated tickets, count outcomes under a documented prize definition, and check whether the declared rate is plausible relative to the Wilson interval and standardized count difference.
A reviewer can compare the observed any-prize rate in a complete campaign log with the pre-published rate, provided ticket eligibility, redemptions, and excluded records are retained.
PROBABILITY GLOSSARY
EVIDENCE AND DATA LINEAGE
Retain game and rule version, drawing or simulation seed, ticket identifiers, event definition, eligible and excluded records, declared odds source, ticket count, win count, confidence level, prize basis, cost basis, collection window, and any stopping rule. Without that lineage, a precise-looking interval can describe the wrong sample.
LIMITS AND EXCLUSIONS
RELIABLE SOURCES
FREQUENTLY ASKED QUESTIONS
The simple Wald interval performs poorly with small samples or proportions near zero or one. Wilson incorporates the score-test geometry and stays within the valid probability range after bounding.
No. The numerator and declared probability must describe the same event. Comparing jackpot wins with any-prize odds produces a mathematically calculated but meaningless diagnostic.
It flags tension between the observed sample and declared model under the stated assumptions. Check event definitions, exclusions, dependence and data collection before treating the difference as substantive.
Zero observed events do not prove zero probability. The upper bound represents rates still compatible with a finite zero-event sample at the selected confidence level.
No under an independent fixed-odds model. The confidence interval summarizes the recorded sample; it does not create memory in the next draw.
No. It uses the declared win probability and one average prize, so it omits the prize distribution and other lottery-specific adjustments needed for a full expected-value model.
IMPORTANT PROBABILITY NOTE
This calculator is educational statistical software, not a detector of rigging and not gambling, legal, financial, or tax advice. Use complete comparable records and current official odds. A confidence interval cannot justify chasing losses or exceeding an entertainment budget.