Live calculation visualCurrent entered assumptions
Unit Converters
Sound Level Scale Calculator
Audit a linear indicated-level mapping while retaining calibration span and out-of-range status.
LINEAR INDICATED-LEVEL MAPPING
Map a live signal to declared sound-level endpoints and expose extrapolation
Enter a live electrical or digital signal plus its two calibration endpoints. The calculator reports mapped dB, span fraction, sensitivity, relative pressure ratio, and whether the live signal is outside the declared range.
Mapped sound level—
Input-span position—
Scale sensitivity—
Pressure ratio from low endpoint—
Range status—
Declared signal span—
CALIBRATION LINE
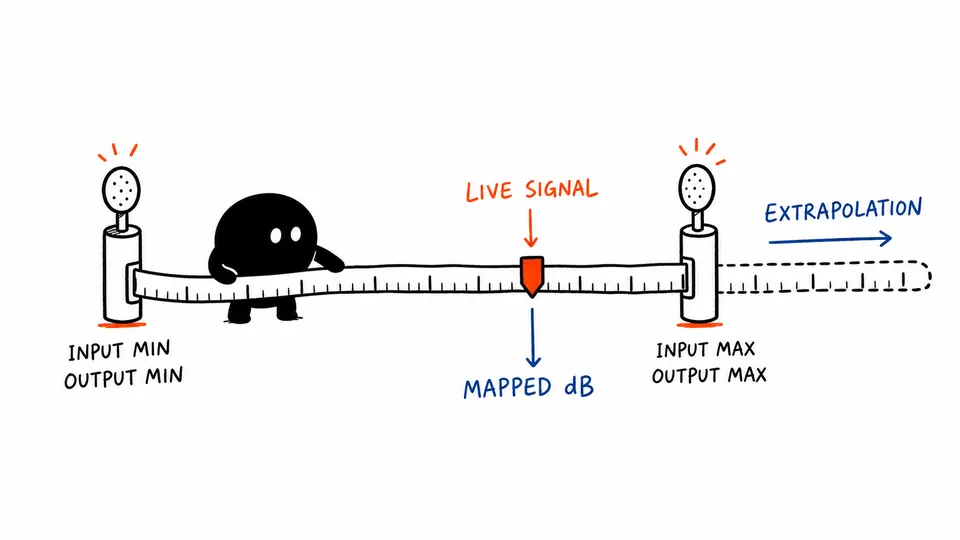
Show the live marker, endpoints, and out-of-range distance
The graph preserves endpoint orientation and extends the line visibly beyond the calibrated span. Extrapolation is labeled rather than silently clamped.
| Element | Signal | Mapped dB | Span fraction | Meaning |
|---|
How to use
Map a live signal to declared sound-level endpoints and expose extrapolation
- Enter Live signal, Signal minimum, Signal maximum.
- Confirm the remaining assumptions use the same project, measurement, or product basis.
- Read Mapped sound level together with Input-span position and Scale sensitivity.
- Use endpoint mapping reconciliation to reconcile the result before exporting it.
- Verify that the live signal and both anchors share one input unit and one transfer-function revision.
CALIBRATION-MAP FUNDAMENTALS
Keep signal anchors, output anchors, span fraction, and extrapolation visible
Required inputs
- Live signal
- Default: 12
- Signal minimum
- Default: 4
- Signal maximum
- Default: 20
- Level at signal minimum (dB)
- Default: 40
- Level at signal maximum (dB)
- Default: 120
Reported outputs
- Mapped sound level
- Input-span position
- Scale sensitivity
- Pressure ratio from low endpoint
- Range status
- Declared signal span
CALCULATION METHOD
Interpolate between declared endpoint pairs
Compute the signed input-span fraction first, then apply that fraction to the signed dB output span. Do not clamp the fraction because out-of-range position is part of the diagnostic result.
CALIBRATION ANCHORS
Paired input and output calibration anchor.
Copy the input and output endpoints from the same calibration record.
EXTRAPOLATION
Maximum minus minimum endpoint.
Confirm the two signal endpoints differ and retain their orientation.
LOGARITHMIC MEANING
Output change per input-unit change.
Calculate the live signal fraction of the input span.
Detailed calculation process
Endpoint mapping reconciliation
f = (x − xmin)/(xmax − xmin)L = Lmin + f(Lmax − Lmin)sensitivity = (Lmax − Lmin)/(xmax − xmin)pressure ratio from Lmin = 10^((L−Lmin)/20)
The signed span fraction remains unrounded through endpoint mapping and range classification; presentation precision does not clamp or change extrapolation status.
| Input | Default substitution | Requirement |
|---|---|---|
| Live signal | 12 | Required; use one consistent unit and basis |
| Signal minimum | 4 | Required; use one consistent unit and basis |
| Signal maximum | 20 | Required; use one consistent unit and basis |
| Level at signal minimum (dB) | 40 | Required; use one consistent unit and basis |
| Level at signal maximum (dB) | 120 | Required; use one consistent unit and basis |
- Apply that fraction to the sound-level output span.
- Compute sensitivity as decibels per signal unit.
- Flag any fraction below 0 or above 1 as extrapolated.
- Verify range, saturation, and detector response before using an extrapolated result.
Current calibration reconciliation will report the signed span fraction, mapped dB value, and any extrapolation beyond the declared anchors.
Result interpretation
Report mapped level together with in-range or extrapolated status
A fraction of 0.5 is the midpoint of the declared signal span and maps to the midpoint in indicated dB. Because the mapping is linear in displayed level, it does not mean pressure amplitude is halfway. The pressure-ratio result illustrates that distinction.
Visual interpretation
Show the live marker, endpoints, and out-of-range distance
The graph preserves endpoint orientation and extends the line visibly beyond the calibrated span. Extrapolation is labeled rather than silently clamped. Read the graphic with the exact ledger: geometry and color show relationships, while the table remains the numerical record.
EVIDENCE FOR THIS MODEL
Retain the endpoint source, units, and adjustment state
Retain sensor and logger identifiers, calibration revision, endpoint units, level quantity and weighting, electrical range, resolution, linearity specification, zero and span checks, saturation behavior, date, temperature, signal conditioning, and extrapolation approval.
SCOPE AND LIMITATIONS
When a linear endpoint map is the wrong model
- Endpoint interpolation does not correct nonlinearity, hysteresis, drift, frequency response, or detector dynamics.
- The output is linear in dB, not in pressure or intensity.
- Extrapolation is arithmetic only and may be physically invalid.
- No clipping or saturation model is applied.
KEY TERMINOLOGY
Signal-mapping and sound-level terms
- Endpoint
- Paired input and output calibration anchor.
- Span
- Maximum minus minimum endpoint.
- Sensitivity
- Output change per input-unit change.
- Interpolation
- Estimate between declared endpoints.
- Extrapolation
- Extension beyond an endpoint.
- Clamping
- Hiding out-of-range values at a boundary; not used here.
PRACTICAL DECISIONS
4–20 mA logger versus Signal beyond 20 mA
4–20 mA logger
A 12 mA signal lies at 50% of the input span. Verify that the transmitter really defines a linear dB output before accepting the mapped level.
Signal beyond 20 mA
The page reports an extrapolated value to expose the arithmetic. Investigate overload, calibration range, wiring, and logger scaling before use.
AUTHORITATIVE BASIS
References for linear indicated-level mapping
Important note
Endpoint interpolation does not correct nonlinearity, hysteresis, drift, frequency response, or detector dynamics. Preserve the entered assumptions, exact ledger, and named source before using mapped sound level in a decision.
Frequently asked questions
Can endpoints descend?
Yes. The mapping preserves their declared orientation.
Does 50% span mean half pressure?
No. It means halfway in the declared dB output scale.
Why not clamp?
Clamping hides evidence that the signal left the declared range.
Can signal units be volts or counts?
Yes, provided both endpoints and the live signal share one unit.
Does the page calibrate a microphone?
No. It evaluates a declared linear mapping.
What if endpoints are equal?
The scale is undefined and the input is rejected.
Is extrapolation always wrong?
Not necessarily, but it requires independent range and physics evidence.
Which output is final?
Mapped dB is the primary result; range status is inseparable from it.