Higher flow helps one metric and hurts another
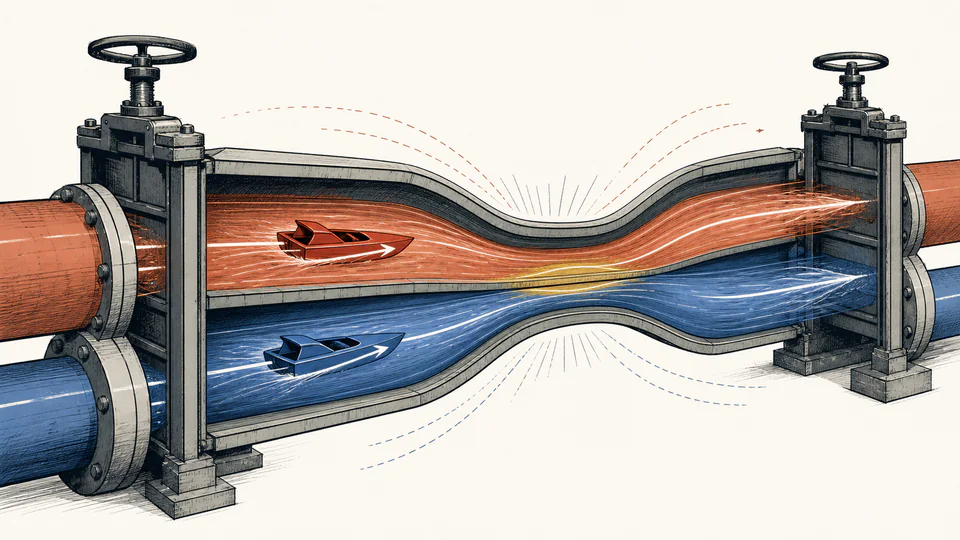
Increasing flow can raise film coefficient and capacity while increasing pressure drop, erosion risk, vibration, and pump demand. A thermal improvement can cross a hydraulic boundary.
Engineering
Compare an exchanger operating point with entered hot/cold flow bands, minimum terminal approach, and maximum pressure drops, then identify the governing boundary.
EXCHANGER OPERATING ENVELOPE
This calculator screens a measured or predicted exchanger point against five entered boundaries: hot-flow band, cold-flow band, minimum terminal approach, hot-side pressure drop, and cold-side pressure drop. It also calculates countercurrent LMTD from the four terminal temperatures. The lowest margin directs review, but the limits must come from the actual datasheet, control philosophy, pump system, vibration assessment, and temperature program.
EXCHANGER OPERATING ENVELOPE
Resolve any negative margin before accepting the operating point. When all margins are positive, investigate the smallest one first and confirm its limit source, measurement uncertainty, control stability, and transient behavior.
| Operating boundary | Minimum / zero | Current condition | Maximum / reference | Normalized margin (%) |
|---|
CURRENT CALCULATION PROCESS
ΔT_1=T_hi−T_co; ΔT_2=T_ho−T_ci; LMTD=(ΔT_1−ΔT_2)/ln(ΔT_1/ΔT_2); m_gov=min(flow-band, approach, ΔP margins)
Positive terminal differences establish a valid LMTD. Each flow is located within its entered min/max band, while approach and pressure drops are compared with their respective limits. Percent margins are used to rank proximity only; they do not combine thermal and hydraulic risk into a probability.
| Input / symbol | Engineering meaning and unit | Current value |
|---|---|---|
| hotFlow | Current hot-side flow — Use one consistent mass or volumetric unit for hot minimum/current/maximum. | 115 |
| hotFlowMin | Minimum hot-side flow — Hydraulic, heat-transfer, or control lower boundary. | 70 |
| hotFlowMax | Maximum hot-side flow — Datasheet or approved system upper boundary. | 150 |
| coldFlow | Current cold-side flow — Use one consistent unit for the cold-side band. | 132 |
| coldFlowMin | Minimum cold-side flow — Lower approved operating boundary. | 85 |
| coldFlowMax | Maximum cold-side flow — Upper approved operating boundary. | 175 |
| hotInC | Hot inlet temperature (°C) — Synchronized terminal temperature. | 108 |
| hotOutC | Hot outlet temperature (°C) — Must maintain a positive terminal difference. | 72 |
| coldInC | Cold inlet temperature (°C) — Synchronized cold inlet. | 30 |
| coldOutC | Cold outlet temperature (°C) — Synchronized cold outlet. | 58 |
| minimumApproachC | Minimum allowed terminal approach (K) — Project or exchanger-specific pinch criterion. | 8 |
| hotPressureDropKpa | Current hot-side ΔP (kPa) — Measured or predicted across the declared exchanger boundary. | 42 |
| hotPressureDropMaxKpa | Maximum hot-side ΔP (kPa) — Approved hydraulic upper limit. | 65 |
| coldPressureDropKpa | Current cold-side ΔP (kPa) — Same taps and flow condition as the assessed point. | 48 |
| coldPressureDropMaxKpa | Maximum cold-side ΔP (kPa) — Approved cold-side hydraulic upper limit. | 72 |
Intermediate values remain unrounded until display formatting.
HOW TO USE THIS MODEL
EXCHANGER OPERATING ENVELOPE FUNDAMENTALS
MODEL AND FORMULA
Positive terminal differences establish a valid LMTD. Each flow is located within its entered min/max band, while approach and pressure drops are compared with their respective limits. Percent margins are used to rank proximity only; they do not combine thermal and hydraulic risk into a probability.
DEEPER ENGINEERING ANALYSIS
Increasing flow can raise film coefficient and capacity while increasing pressure drop, erosion risk, vibration, and pump demand. A thermal improvement can cross a hydraulic boundary.
Deposits reduce U and flow area, changing approach and pressure drop simultaneously. Trending one metric without the other can misdiagnose fouling as a utility-temperature problem.
A control valve may maintain outlet temperature by changing flow, but the resulting low-flow distribution or high pressure drop can violate another boundary. Evaluate the control action, not just the controlled result.
WORKED DECISION CASES
Warm cold inlet reduces terminal approach while operators increase cooling-water flow. The pinch and cold-side pressure-drop margins may compete, requiring a system rather than exchanger-only solution.
Both flows remain under their maximums, but one falls below its distribution limit. Outlet temperature looks acceptable while maldistribution and fouling risk increase.
TECHNICAL LANGUAGE
EVIDENCE AND DATA LINEAGE
Retain exchanger datasheet and arrangement, approved min/max flows, pressure-drop limits and tap locations, minimum approach criterion, sensor and flowmeter calibrations, synchronized raw data, averaging and stabilization rules, fluid properties and phases, valve/bypass positions, pump state, fouling history, seasonal utility conditions, and cases evaluated. Preserve limit provenance because a margin has no meaning after the governing datasheet or boundary changes.
LIMITS AND EXCLUSIONS
RELIABLE SOURCES
FREQUENTLY ASKED QUESTIONS
The point has no remaining band width on that side. A positive in-band value peaks near the center, while a negative value means the entered flow is outside the approved band.
Not with this positive-difference logarithmic relation. Recheck flow arrangement, sensor labels, temperature cross, phase behavior, and model choice.
No. Each boundary must pass independently. A favorable hydraulic margin cannot compensate for an invalid thermal approach.
Use approved vendor or project limits that consider distribution, heat transfer, vibration, erosion, pumps, valves, and control—not arbitrary percentages of design flow.
Deposits add thermal resistance and reduce hydraulic area. Tracking both quantities helps distinguish fouling from changes in utility temperature or flow.
No. Startup includes thermal expansion, transient stress, phase displacement, venting, control sequencing, and rapid property changes that a steady point does not model.
IMPORTANT ENGINEERING NOTE
A qualified process, mechanical, and controls team must confirm exchanger and system limits, pressure equipment requirements, vibration, erosion, thermal expansion, relief, materials, phase behavior, control sequencing, and transient cases. Stop and investigate a crossed or rapidly deteriorating boundary.
RELATED CALCULATORS
Use a separate model for the next boundary instead of folding it into this result.