Measurement uncertainty
Small errors in flow, pressure, power, elevation, or density can materially change the ratio, especially at low head or power.
Engineering
Calculate hydraulic power, estimated shaft power, pump efficiency, wire-to-water efficiency, total loss, reference input, and excess input from measured duty data.
MEASURED PUMP PERFORMANCE
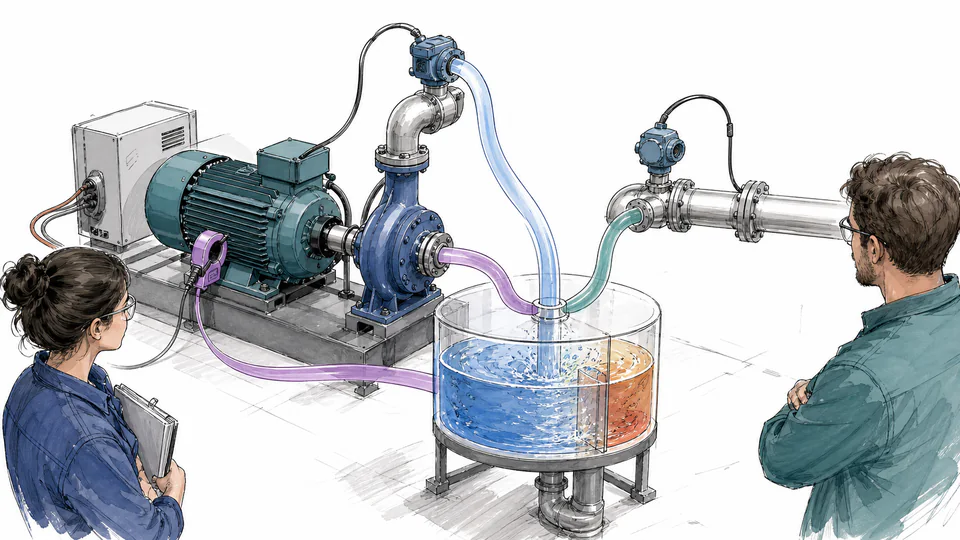
This calculator is intended for energy assessors and reliability engineers evaluating a pump at a measured operating point. Flow, total dynamic head, density, and electrical input establish hydraulic output and wire-to-water efficiency. Entered motor and drive efficiencies estimate shaft power so pump efficiency can be separated from upstream losses, while a reference pump efficiency provides a same-duty input comparison.
MEASURED PUMP PERFORMANCE
Compare the measured point with the manufacturer curve, operating region, and a credible reference—not with a universal efficiency target. Excess input can indicate opportunity, but instrumentation bias, throttling, wear, viscosity, and system demand must be diagnosed before a corrective action is chosen.
| Assessment layer | Field measurement | Loss boundary | Reference basis | Calculated outcome |
|---|
CURRENT CALCULATION PROCESS
Ph = ρgQH; Pshaft = Pelecηmotorηdrive; ηpump = Ph/Pshaft; ηwire-water = Ph/Pelec
Simultaneous hydraulic measurements establish useful liquid power. Measured real electrical input is reduced by motor and drive losses to estimate pump shaft input; pump and wire-to-water efficiencies are therefore not mislabeled as the same metric.
Intermediate values remain unrounded until display formatting.
HOW TO USE THIS MODEL
MEASURED PUMP PERFORMANCE FUNDAMENTALS
MODEL AND FORMULA
Simultaneous hydraulic measurements establish useful liquid power. Measured real electrical input is reduced by motor and drive losses to estimate pump shaft input; pump and wire-to-water efficiencies are therefore not mislabeled as the same metric.
SYMBOLS AND DEFAULT CASE
| Symbol or input | Meaning | Unit or default |
|---|---|---|
| P_h | Measured-duty hydraulic output | kW |
| P_elec | Measured upstream electrical input | kW |
| P_shaft | Estimated pump shaft input | kW |
| eta_motor | Motor efficiency at the measured duty | dimensionless |
| eta_drive | Drive efficiency at the measured duty | dimensionless |
| eta_pump | Hydraulic output divided by shaft input | dimensionless |
| flowM3h | Measured flow (m³/h) | 240 |
| totalHeadM | Measured total head (m) | 36 |
| densityKgM3 | Fluid density (kg/m³) | 997 |
| measuredMotorInputKw | Measured electrical input (kW) | 34 |
| motorEfficiencyPercent | Motor efficiency (%) | 93 |
| driveEfficiencyPercent | Drive efficiency (%) | 97 |
| referencePumpEfficiencyPercent | Reference pump efficiency (%) | 82 |
Percent inputs are converted to decimal factors once. The live calculation process above substitutes the current values in order, names intermediate quantities, reports the final result, and closes with a reverse or conservation check.
DEEP ENGINEERING ANALYSIS
Small errors in flow, pressure, power, elevation, or density can materially change the ratio, especially at low head or power.
A throttled or bypassed system may waste energy even when the pump itself is near its expected curve efficiency.
Viscosity, wear, recirculation, impeller damage, clearances, and gas entrainment can change head and efficiency relative to water-test curves.
WORKED DECISION CASES
Wire-to-water efficiency is low, but the pump matches its curve near the measured point; the system control strategy, not internal pump wear, is the first improvement target.
Synchronized testing shows lower head and efficiency than the certified curve at matching flow and speed, supporting an inspection after instrument uncertainty is checked.
TECHNICAL GLOSSARY
EVIDENCE AND DATA LINEAGE
Retain timestamps, meter IDs and uncertainty, pressure tap elevations and diameters, flow method, speed, fluid density/temperature/viscosity, electrical power boundary, motor/drive efficiency sources, pump curve and trim, valve and bypass positions, reference selection, raw observations, and unrounded calculations.
LIMITS AND EXCLUSIONS
RELIABLE SOURCES
FREQUENTLY ASKED QUESTIONS
Wire-to-water includes motor and drive losses; pump efficiency uses shaft power as its input.
It is a preliminary estimate. Efficiency varies with load, speed, voltage, and motor condition.
The page rejects it because measurement boundaries, units, density, head, flow, or upstream efficiencies are inconsistent.
Only when the measured point matches BEP. Otherwise compare with the curve efficiency at the actual flow and speed.
No. Measurement bias, viscosity, gas, recirculation, throttling, speed, or system conditions may explain the result.
Density converts volumetric flow and head to hydraulic power and differs from water for many process liquids.
IMPORTANT ENGINEERING NOTE
A qualified pump-system professional should validate instruments and boundaries, compare the point with certified curves, examine the system curve and controls, check NPSH and operating region, review fluid corrections and mechanical condition, and verify savings across the load profile.