Control changes
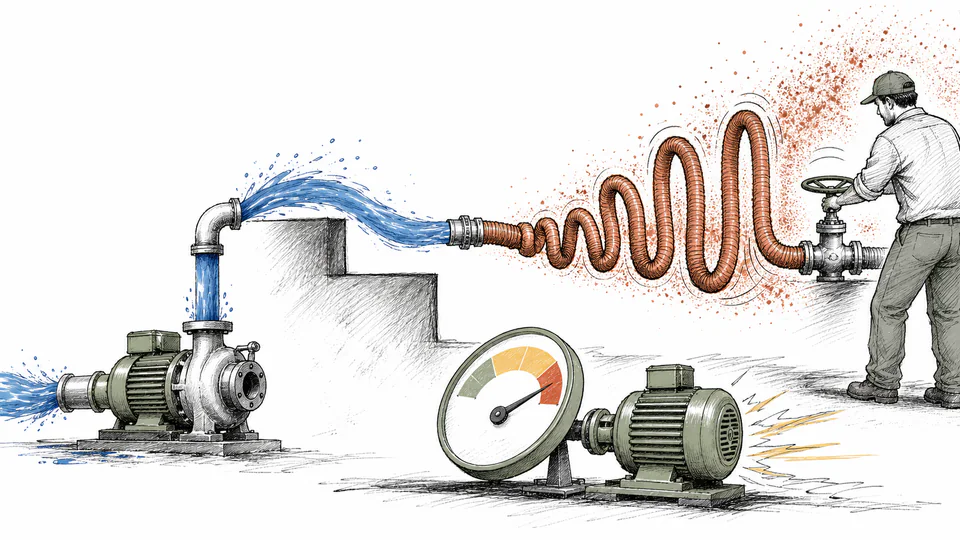
A valve position, bypass, or parallel-pump change creates a different system curve rather than a simple movement on the original one.
Engineering
Test how a flow change alters friction head, total head, shaft power, and specific energy while keeping static head and efficiency change explicit.
PUMP DUTY SENSITIVITY
This calculator examines one pump-system scenario near a documented baseline. It checks that entered base head agrees with static plus friction head, changes flow by a stated percentage, scales the friction component with flow ratio squared, applies a declared efficiency-point change, and recomputes shaft power and specific energy. It is designed to expose drivers—not to replace a pump and system curve solver.
PUMP DUTY SENSITIVITY
Use the result to see whether flow, system resistance, or efficiency dominates a power forecast. If the scenario is far from baseline, speed changes, valve positions, parallel pumps, or curve shape can invalidate the quadratic approximation and require full pump/system curves.
| Scenario layer | Baseline state | Change rule | Scenario state | Energy consequence |
|---|
CURRENT CALCULATION PROCESS
Qs = Qb(1 + ΔQ); Hs = Hstatic + Hfriction,b(Qs/Qb)²; Ps = ρgQsHs/ηs; ΔP = (Ps/Pb − 1) × 100%
The model separates head that does not change with flow from a friction component assumed proportional to flow squared. Scenario pump efficiency is entered as a percentage-point change because efficiency generally moves along the pump curve rather than following the affinity laws.
Intermediate values remain unrounded until display formatting.
HOW TO USE THIS MODEL
PUMP DUTY SENSITIVITY FUNDAMENTALS
MODEL AND FORMULA
The model separates head that does not change with flow from a friction component assumed proportional to flow squared. Scenario pump efficiency is entered as a percentage-point change because efficiency generally moves along the pump curve rather than following the affinity laws.
SYMBOLS AND DEFAULT CASE
| Symbol or input | Meaning | Unit or default |
|---|---|---|
| Q_b | Baseline volumetric flow | m3/h |
| Q_s | Scenario volumetric flow | m3/h |
| H_static | Flow-independent system head | m |
| H_friction,b | Baseline friction-head component | m |
| eta_s | Scenario pump efficiency | dimensionless |
| P_s | Scenario pump shaft power | kW |
| baseFlowM3h | Baseline flow (m³/h) | 200 |
| baseHeadM | Baseline total head (m) | 45 |
| densityKgM3 | Fluid density (kg/m³) | 998 |
| baseEfficiencyPercent | Baseline pump efficiency (%) | 80 |
| flowChangePercent | Scenario flow change (%) | 20 |
| staticHeadM | Static head component (m) | 15 |
| frictionHeadAtBaseM | Baseline friction head (m) | 30 |
| efficiencyChangePoints | Efficiency change (percentage points) | -4 |
Percent inputs are converted to decimal factors once. The live calculation process above substitutes the current values in order, names intermediate quantities, reports the final result, and closes with a reverse or conservation check.
DEEP ENGINEERING ANALYSIS
A valve position, bypass, or parallel-pump change creates a different system curve rather than a simple movement on the original one.
Affinity laws require similarity assumptions; static head and efficiency behavior prevent a universal cubic power rule for every installed system.
Power can be very sensitive to efficiency when operation moves away from BEP, so curve or field evidence matters as much as the flow forecast.
WORKED DECISION CASES
A 20% flow increase raises friction head by 44%, while static head is unchanged. The resulting power increase is larger than a linear flow estimate.
Reduced flow lowers friction, but efficiency also drops off design. Specific energy reveals whether throttling actually improves the energy intensity of delivery.
TECHNICAL GLOSSARY
EVIDENCE AND DATA LINEAGE
Keep baseline flow/head/power timestamps or design case, suction/discharge boundaries, system-curve derivation, static elevation/pressure basis, friction estimate, pump curve and speed, efficiency evidence, fluid density/viscosity/temperature, control configuration, scenario cause, unrounded ratios, and comparison results.
LIMITS AND EXCLUSIONS
RELIABLE SOURCES
FREQUENTLY ASKED QUESTIONS
For many turbulent systems with similar friction factors, pressure loss is approximately proportional to velocity and flow squared.
Static elevation or pressure head does not change with flow in the simplified system.
No. The cubic affinity relation applies under specific similarity conditions and does not automatically include static head or efficiency shifts.
Moving from 80% to 76% is a four-percentage-point change, which is clearer than mixing relative and absolute percent changes.
The page rejects materially inconsistent values so the scenario does not start from an unreconciled head split.
Not directly. Parallel operation changes the combined pump curve and operating point and needs a dedicated system analysis.
IMPORTANT ENGINEERING NOTE
Before changing speed, control, impeller, or pump count, a qualified pump-system professional must reconcile certified pump curves and system curves, operating region, NPSH margin, minimum flow, driver limits, transients, fluid properties, control stability, and manufacturer guidance.