850 nm receiver count budget
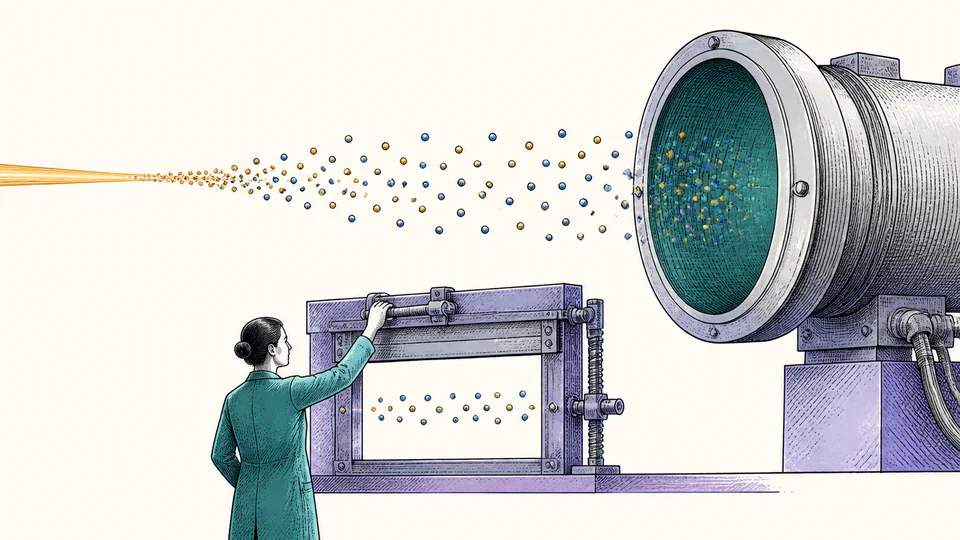
A 1 mW narrowband source at the detector input and 65% efficiency yields a rate budget for a 10 us acquisition gate before hardware saturation is assessed.
Physics and electromagnetism
Convert monochromatic optical power and wavelength into photon arrival rate, ideal detected-event rate, and expected events within a measurement gate.
Photon arrival and detection rate
Here, rate means expected photons or ideal detection events per second. It is deliberately distinct from wave frequency, data throughput, pulse-repetition rate, and a realized integer counter trace.
Current model evidence
Follow one joule-per-second stream through photon energy and an explicit detection probability.
| Stage | Energy or power | Rate | Gate duration | Expected gate count |
|---|
DETAILED CALCULATION PROCESS
E_gamma = h c/lambda; R_gamma = P/E_gamma; R_det = eta R_gamma; mu_gate = R_det Delta t_gate
A monochromatic photon has energy h c/lambda. Dividing average optical power by that energy gives expected photon arrivals per second; multiplying by an ideal efficiency gives expected detection events.
| Symbol | Meaning | Unit | Default basis |
|---|---|---|---|
| P | Average optical power at detector input | W | 1 mW = 0.001 W |
| lambda | Vacuum wavelength | m | 850 nm |
| E_gamma | Single-photon energy | J | calculated |
| R_gamma | Expected incident photon rate | photons/s | calculated |
| eta | Independent detection efficiency | 1 | 0.65 |
| R_det | Ideal detected-event rate | events/s | calculated |
| Delta t_gate | Measurement gate duration | s | 10 us |
HOW TO USE THIS CALCULATOR
PHYSICS FOUNDATIONS FOR THIS MODEL
DEEP ANALYSIS 1
Independent rare events are often modeled with a Poisson distribution. This calculator supplies its mean but not confidence intervals, pile-up, or a random realization.
DEEP ANALYSIS 2
At high rates, a detector may be unable to register arrivals during recovery. A constant eta then overstates observed count rate.
DEEP ANALYSIS 3
For a spectrum P(lambda), photon rate is the integral of P(lambda)/(h c/lambda). One nominal wavelength can bias a broadband result.
RESULT INTERPRETATION
Zero efficiency is a valid boundary: incident photons remain positive while ideal detected events become zero. Zero optical power is rejected because this page is designed around a defined active stream rather than an off-state.
A very large events-per-gate value can signal saturation risk, but detector bandwidth, dead time, analog gain, and counter architecture must be checked separately.
REAL USE CASES
A 1 mW narrowband source at the detector input and 65% efficiency yields a rate budget for a 10 us acquisition gate before hardware saturation is assessed.
A laboratory uses picowatt-level received power and a nanosecond gate. The expected count may be far below one, which means most gates are empty rather than physically fractional detections.
EVIDENCE AND DATA QUALITY
Retain the detector-plane power measurement, spectral bandwidth, wavelength calibration, definition and provenance of efficiency, gate timing, dark-count characterization, and any attenuation between the measurement plane and active detector area.
LIMITS AND EXCLUSIONS
TERMS USED HERE
RELIABLE SOURCES
FREQUENTLY ASKED QUESTIONS
No. Optical frequency is cycles per second; photon rate depends on both power and energy per photon.
It is a long-run mean across repeated gates, not the count in one specific gate.
Yes. It produces zero ideal detected events while preserving the incident photon stream.
No. Add a measured dark-event rate separately when predicting total observed counts.
The simple linear model can overpredict counts because dead time and pile-up become important.
Only with a representative wavelength approximation; a spectral integral is preferred for broad sources.
IMPORTANT BOUNDARY
This ideal mean-rate estimate does not certify detector linearity, timing performance, eye safety, communication reliability, or a statistical confidence level.