Physics and mechanics
Sound Wave Rate Calculator
Infer acoustic power from a free-field RMS pressure measurement, distance, medium impedance, and declared source directivity.
CURRENT MODEL
Define one free-field pressure measurement and its geometry
Noise-control engineers, field technicians, equipment buyers, and acoustics students screening a source before a standards-based sound-power survey.
Decision supportedTranslate one free-field pressure observation into an estimated source emission rate and decide whether distance or directivity assumptions dominate the result.
LIVE SOURCE-POWER INFERENCE
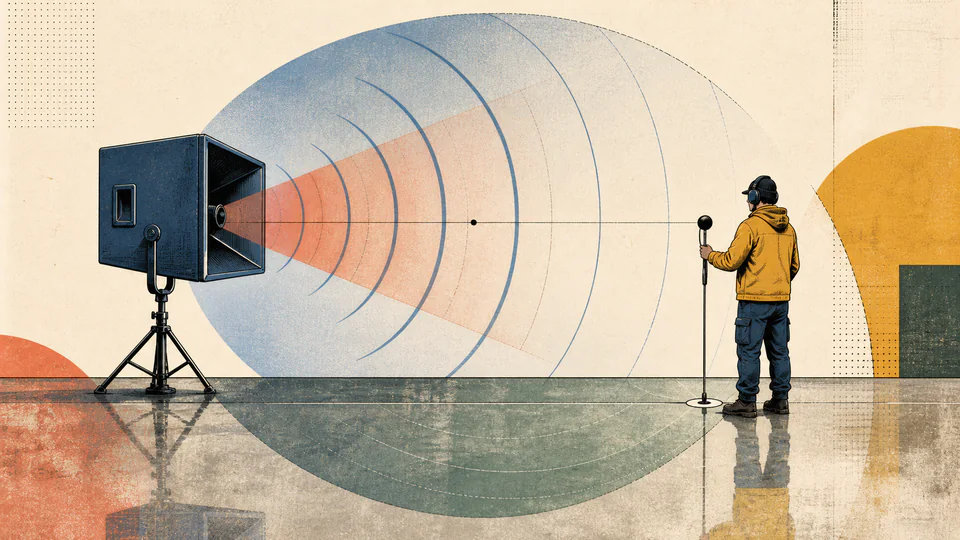
Measurement point, radiation area, and inferred source rate
The live field view scales the receiver radius and labels the current directivity-adjusted area, local intensity, and acoustic power.
| Quantity | Equation | Current value | Unit |
|---|
How to use
Turn a field pressure into a source-rate screen
- Measure source-only RMS pressure at a point where the direct field dominates background and reflections.
- Enter medium density and sound speed from the same environmental condition.
- Measure straight-line distance from the source acoustic center to the microphone.
- Choose a defensible directivity factor Q rather than treating every source as omnidirectional.
- Inspect the local intensity and effective radiation area before reading total sound power.
- Use the inverse-square reconstruction to confirm that the reported power returns the original receiver intensity.
Source-rate fundamentals
Six distinctions behind the inverse field estimate
- Sound pressure
- A local field quantity that changes with position and environment.
- Sound intensity
- Local directional power flow per area, inferred here from a progressive wave.
- Sound power
- A source emission rate that is ideally independent of receiver distance.
- Radiation area
- 4 pi r squared for full space, reduced by Q for the measured direction.
- Directivity factor
- Ratio of directional intensity to the spherical-average intensity at the same radius.
- Power level
- Ten times log10 of acoustic power relative to 1 picowatt.
Calculation method
Remove medium impedance, spreading, and declared directivity
RMS pressure first becomes local plane-wave intensity through p_rms squared divided by rho c. The source power estimate then multiplies this intensity by the effective radiation area 4 pi r squared divided by Q.
A final logarithmic conversion reports sound power level only when estimated power is positive. At exactly zero pressure, zero watts is meaningful but a finite decibel power level is not.
Far-field placement
Near a large source, pressure phase and spatial variation may not behave as spherical spreading. Increase distance or use a standards-based measurement surface.
Directivity uncertainty
Q can vary strongly with frequency and direction. One broadband factor can hide lobes, nulls, mounting effects, and reflective boundaries.
Background contamination
Uncorrected background raises measured RMS pressure and is squared in the intensity estimate. Retain source-on and source-off evidence.
Distance consistency
In an ideal free field, doubling distance lowers intensity by four while inferred source power remains constant. Failure of that check exposes boundary or geometry problems.
Detailed calculation process
Symbols, current substitution, intermediate quantities, and reconciliation
I = p_rms^2/(rho c); W = 4 pi r^2 I/Q; Lw = 10 log10(W/10^-12 W)Power is retained at full precision and displayed adaptively. Sound power level is shown only when power is positive because log10(0) is undefined.
| Symbol | Meaning | Default | Unit |
|---|---|---|---|
| p_rms | Measured RMS acoustic pressure | 0.2 | Pa |
| rho | Medium density | 1.204 | kg/m3 |
| c | Sound speed | 343 | m/s |
| r | Source-to-receiver distance | 2 | m |
| Q | Directivity factor in measurement direction | 2 | dimensionless |
| W | Estimated source acoustic power | calculated | W |
| Lw | Sound power level re 1 pW | calculated | dB |
Waiting for valid inputs.
Interpretation
Use invariance with distance as a field-quality check
Repeat measurements at defensible radii. If pressure follows the expected inverse-distance trend, each estimate should return similar source power. Large disagreement indicates near-field behavior, reflections, background, incorrect acoustic center, or changing directivity.
Evidence and measurement
Preserve geometry and source state with the pressure record
Retain microphone calibration, bandwidth and weighting, source operating condition, background measurement, receiver coordinates, acoustic-center definition, ground and wall geometry, temperature and medium data, and the evidence supporting Q. Photograph the setup when placement affects reproducibility.
Scope and limitations
What a one-point free-field screen excludes
- Standards-based multi-position surface averaging and environmental corrections
- Near-field reactive energy and spatially extended sources
- Room reverberation, barriers, atmospheric gradients, and ground interference
- Frequency-band directivity and tonal uncertainty
- Time-varying duty cycle or source operating-state drift
- Noise compliance, hearing conservation, or product certification
The source is compact relative to distance, propagation is approximately free field, RMS pressure represents the source alone, spherical spreading applies, and the directivity factor describes the measurement direction.
Key terminology
Sound-power inference glossary
- Acoustic center
- Effective origin from which source distance is measured.
- Free field
- An environment where direct sound dominates reflected sound.
- Far field
- Region where wavefront and directional behavior are sufficiently stable for the chosen model.
- Directivity factor
- Dimensionless concentration of intensity in one direction.
- Inverse-square law
- Intensity decrease proportional to one over distance squared for spherical spreading.
- Sound power
- Total acoustic energy emitted per unit time.
- Sound power level
- Logarithmic sound power relative to 10^-12 W.
- Background correction
- Adjustment separating source contribution from unrelated ambient noise.
Practical cases
Two field screens with different directivity risks
Machine above a reflecting floor
A technician uses Q = 2 as an initial hemispherical screen and repeats measurements at two distances. Agreement supports the estimate; nearby walls and machine shape still motivate a formal sound-power survey.
Directional alarm horn
An on-axis pressure reading is paired with manufacturer polar data rather than Q = 1. The inferred total power is documented as frequency-specific because off-axis radiation and mounting change the effective Q.
Important note
One pressure point is not a certified sound-power test
Use the result for transparent screening only. Formal declarations require prescribed measurement surfaces, positions, background and environment corrections, frequency bands, and uncertainty treatment.
Frequently asked questions
Why is this called a rate calculator?
Acoustic power is the rate at which the source emits sound energy, measured in joules per second or watts. It differs from the pressure measured at one location.
What does directivity factor Q change?
For the same on-axis intensity and distance, a larger Q implies the source concentrates energy into a smaller effective solid angle, so less total power is needed to produce that local intensity.
Can I compare two machines from different distances?
Only if both measurements satisfy the same free-field and directivity assumptions. The model removes ideal spherical spreading, but it cannot remove reflections, background noise, or near-field behavior.
Why is sound power level undefined at zero pressure?
Zero pressure gives zero estimated acoustic power. The logarithmic level formula uses log10(W/W0), which has no finite value at W = 0, so the calculator reports the level as not defined.
Is Q = 2 always correct above a floor?
No. A reflecting plane motivates a hemispherical idealization, but actual equipment directivity, mounting, barriers, and frequency alter the radiation pattern. Use measured or documented Q when available.
Can this replace an ISO sound-power test?
No. Screening from one point omits spatial averaging, environmental corrections, background correction, instrumentation classes, and frequency-band procedures required by formal methods.
Authority and follow-on work
Reliable sources and related calculators
- NIOSH — Industrial Noise Control ManualSupports relationships among sound pressure, intensity, source power, distance, and directivity.
- NIOSH — Directivity in Free-Field MeasurementsProvides practical context for source directivity and free-field measurement geometry.
- NIOSH — Sound Power Level CompendiumSupports sound-power terminology and the 1 pW reference convention.
Related calculators
Continue with a distinct physics question without silently changing the model boundary.