Open corridor walls
Long panels may reduce butt joints and labor while remaining easy to stage. Option B can lead on both cost and duration when evidence supports its productivity.
Home & Construction
Hold the net project area constant while evaluating two fully declared alternatives instead of labeling one vaguely cheap or efficient.
DRYWALL OPTION COMPARISON
Both options use the same net scope but retain independent sheet sizes, allowances, prices, finish-material rates, productivity, and labor rates. The page reports cost and waste leaders separately rather than forcing one universal winner.
EDITORIAL FIELD GUIDE
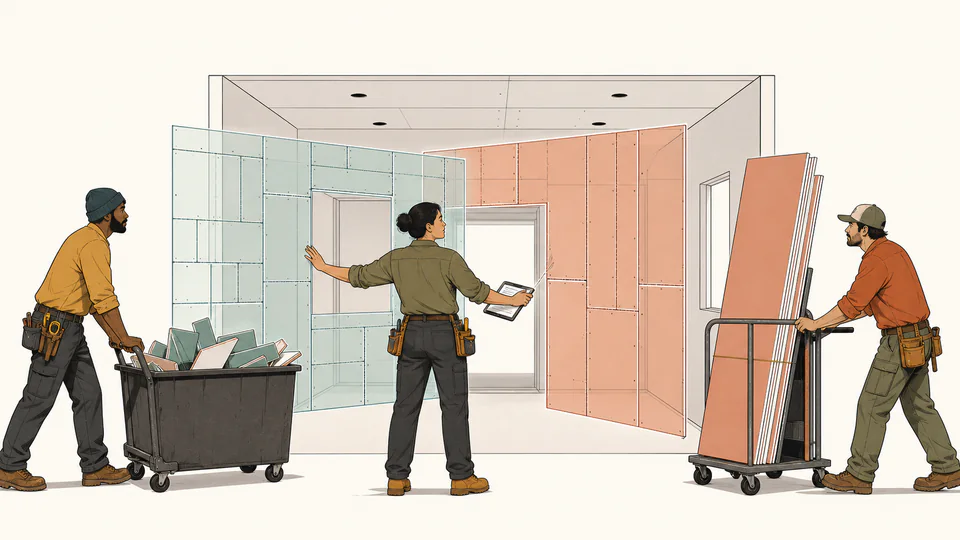
The illustration is explanatory, not a graph and not a source of numeric results. Current values are reconciled only in the result cards and exact table below.
| Metric | Option A | Option B | B minus A | Decision use |
|---|
How to use
Comparison fundamentals
Calculation method
Each option converts its sheet dimensions to area, applies its own allowance, rounds to whole sheets, prices those sheets, adds finish material by common net area, and converts the option-specific productivity to labor-hours and crew-days. The comparison then reports B minus A and identifies lower cost and lower surplus separately.
Scope equivalence
A low-cost standard board is not an alternative to Type X, abuse-resistant, moisture-resistant, impact-rated, shaftliner, or acoustic board unless the governing assembly permits it. Confirm thickness, layers, edge type, rating, finish level, and tested assembly before comparing money.
Productivity evidence
Option productivity should reflect room geometry, framing, lift access, delivery route, crew skill, safety controls, and board weight. Do not assume a longer sheet is always faster simply because it covers more area.
Cost boundary
The model includes whole sheets, an entered finish-material rate, and installation labor. Delivery, lifts, protection, disposal, primer, bead, backing, fastening, overtime, tax, mobilization, and rework need aligned additions outside this page if they differ between options.
Detailed calculation process
The current result cards and option ledger above provide the final reconciliation.
Result interpretation
A lower total means only that the entered sheet, finish-material, and labor assumptions sum to less. A different option may be required for fire, sound, moisture, durability, access, warranty, procurement, or schedule reasons.
Decision analysis
If the cheaper option creates more surplus, decide whether offcuts are usable, disposal is material, and labor estimates already reflect the added cutting. If the faster option costs more, quantify whether the calendar or access benefit is worth the premium.
Evidence and data lineage
Keep common scope drawings, option names, manufacturer and SKU, thickness and rating, sheet dimensions, package price date, delivery terms, allowance rationale, finish-material basis, productivity source, labor burden, crew size, work hours, room layout, access constraints, disposal treatment, and excluded costs.
Limits and exclusions
Key terminology
Worked decision cases
Long panels may reduce butt joints and labor while remaining easy to stage. Option B can lead on both cost and duration when evidence supports its productivity.
Long panels may not turn through the delivery route. Smaller sheets can be the feasible option even when their arithmetic count and modeled labor are higher.
Authoritative basis
Compare only technically acceptable alternatives and reconcile missing cost layers before acting on the lower modeled total.
Holding scope constant isolates differences in sheet plan, allowance, price, and productivity.
Yes. Enter the actual burdened rate for each crew or contractor.
Cost and purchased surplus answer different questions and can point to different options.
Not automatically. The actual room and panel layout determine joint length and location.
Only when the design permits both. Required fire, sound, moisture, and durability performance comes first.
No. It is an arithmetic leader within the entered cost boundary, not a complete selection decision.