Live calculation visualCurrent entered assumptions
Home & Construction
Framing Scenario Comparison Calculator
Expose the cost and schedule tradeoff between two proposed framing layouts without treating spacing as structurally interchangeable.
FRAMING OPTION TRADEOFF
Compare two allowed stud layouts on material, labor, cost, and crew duration
Keep common wall scope fixed while testing two spacing, stud-cost, and productivity assumptions. The page calculates each scenario independently and reports both the cheaper and faster option.
Lower modeled cost—
Shorter modeled duration—
Scenario A total—
Scenario B total—
B − A cost—
B − A crew days—
SIDE-BY-SIDE FRAME DECISION
See whether fewer studs survive labor and unit-cost differences
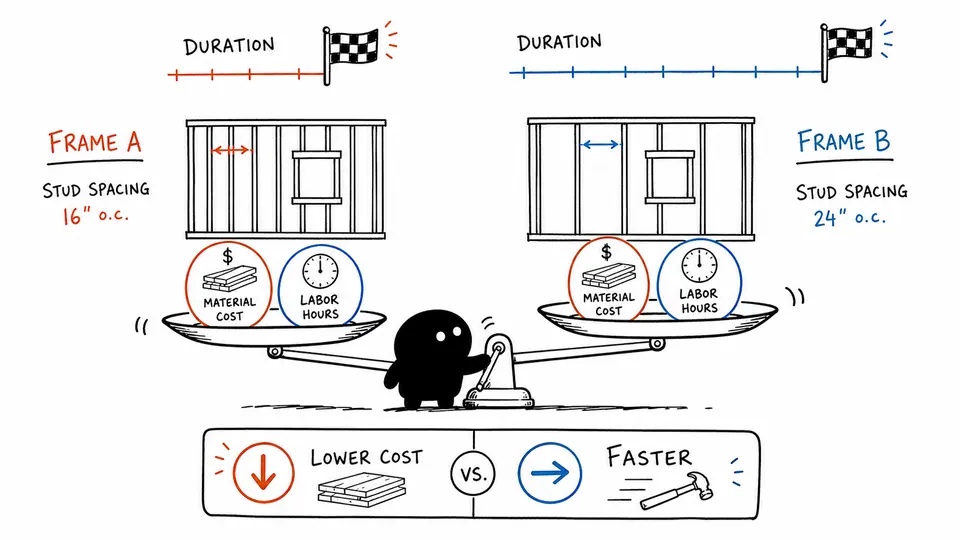
Two wall elevations retain actual stud counts while paired cost stacks and duration bars prevent a one-metric decision.
| Metric | Scenario A | Scenario B | Difference | Decision relevance |
|---|
How to use
Compare two allowed stud layouts on material, labor, cost, and crew duration
- Enter Common wall length (ft), Common openings, Crew size.
- Confirm the remaining assumptions use the same project, measurement, or product basis.
- Read Lower modeled cost together with Shorter modeled duration and Scenario A total.
- Use scenario a versus b ledger to reconcile the result before exporting it.
- Confirm both layouts are technically permitted before allowing modeled cost or duration to control the choice.
FRAMING ALTERNATIVE FUNDAMENTALS
Hold common scope fixed while varying layout, cost, and productivity
Required inputs
- Common wall length (ft)
- Default: 60
- Common openings
- Default: 2
- Crew size
- Default: 3
- Workday (hours)
- Default: 8
- Loaded labor rate ($/labor-hour)
- Default: 45
- Scenario A spacing (in o.c.)
- Default: 16
- Scenario A cost per stud ($)
- Default: 7
- Scenario A productivity (studs/labor-hour)
- Default: 2
- Scenario B spacing (in o.c.)
- Default: 24
- Scenario B cost per stud ($)
- Default: 9
- Scenario B productivity (studs/labor-hour)
- Default: 2.5
Reported outputs
- Lower modeled cost
- Shorter modeled duration
- Scenario A total
- Scenario B total
- B − A cost
- B − A crew days
CALCULATION METHOD
Evaluate each layout as a complete option
Count members independently for each spacing, apply its own unit cost and productivity, add labor with one loaded rate, and compare cost and duration without assuming structural equivalence.
SCOPE EQUIVALENCE
Inputs held constant across alternatives.
Hold wall length, opening count, crew size, workday, and labor rate constant.
MATERIAL–LABOR TRADE
One internally consistent set of assumptions.
Use only spacing options permitted by the design and code.
DOWNSTREAM EFFECTS
Hourly labor cost including selected burdens.
Calculate a separate stud count for each on-center spacing.
Detailed calculation process
Scenario A versus B ledger
studs = ceil(length×12/spacing)+1+4×openingslabor hours = studs/productivitytotal cost = studs×unit cost + labor hours×labor ratecrew days = labor hours/(crew×hours/day)
Each option applies its own whole-member rule before labor and cost are calculated; cost and duration comparisons use unrounded downstream values.
| Input | Default substitution | Requirement |
|---|---|---|
| Common wall length (ft) | 60 | Required; use one consistent unit and basis |
| Common openings | 2 | Required; use one consistent unit and basis |
| Crew size | 3 | Required; use one consistent unit and basis |
| Workday (hours) | 8 | Required; use one consistent unit and basis |
| Loaded labor rate ($/labor-hour) | 45 | Required; use one consistent unit and basis |
| Scenario A spacing (in o.c.) | 16 | Required; use one consistent unit and basis |
| Scenario A cost per stud ($) | 7 | Required; use one consistent unit and basis |
| Scenario A productivity (studs/labor-hour) | 2 | Required; use one consistent unit and basis |
| Scenario B spacing (in o.c.) | 24 | Required; use one consistent unit and basis |
| Scenario B cost per stud ($) | 9 | Required; use one consistent unit and basis |
| Scenario B productivity (studs/labor-hour) | 2.5 | Required; use one consistent unit and basis |
- Apply each scenario’s own unit cost and productivity.
- Convert labor-hours to crew days on the shared crew basis.
- Compare total cost and duration separately; neither automatically governs.
- Document downstream effects on sheathing, insulation, services, finishes, and structural design outside this limited comparison.
Current alternative reconciliation will preserve each layout’s member count, material price, labor demand, cost, and crew duration.
Result interpretation
Lower modeled cost matters only after both layouts are eligible
The lower-cost scenario may not be the faster one. Wider spacing can reduce stud count, but it may change permitted wall height, sheathing, siding, drywall, insulation, blocking, fastener schedules, and trade coordination. The model deliberately does not call the scenarios structurally interchangeable.
Visual interpretation
See whether fewer studs survive labor and unit-cost differences
Two wall elevations retain actual stud counts while paired cost stacks and duration bars prevent a one-metric decision. Read the graphic with the exact ledger: geometry and color show relationships, while the table remains the numerical record.
EVIDENCE FOR THIS MODEL
Freeze drawings, included work, rates, and eligibility for both options
Retain drawing and wall-type revision, approved spacing options, opening allowance, lumber grade and size, unit-price date and supplier, waste and delivery assumptions, measured crew productivity, loaded labor rate, workday, downstream scope changes, structural approval, and selected decision criterion.
SCOPE AND LIMITATIONS
Why the cheaper row is not automatic approval
- The four-stud-per-opening allowance is only a common planning rule.
- No structural equivalence, code permission, thermal benefit, or finish-system compatibility is established.
- Material cost covers entered studs only. Plates, headers, blocking, hardware, sheathing, and waste are excluded.
- Productivity inputs must include the same labor scope.
KEY TERMINOLOGY
Framing comparison terminology
- Common scope
- Inputs held constant across alternatives.
- Scenario
- One internally consistent set of assumptions.
- Loaded labor rate
- Hourly labor cost including selected burdens.
- Productivity
- Studs installed per labor-hour on matching scope.
- Cost difference
- Scenario B total minus Scenario A total.
- Crew-day difference
- Scenario B duration minus Scenario A duration.
PRACTICAL DECISIONS
B is cheaper and faster versus A costs more but shortens downstream work
B is cheaper and faster
Confirm that 24-inch spacing is permitted for the complete wall assembly and that downstream materials do not erase the modeled savings.
A costs more but shortens downstream work
The stud-only result may miss easier board layout or service coordination. Expand the comparison scope before selection.
AUTHORITATIVE BASIS
References for framing option tradeoff
Important note
The four-stud-per-opening allowance is only a common planning rule. Preserve the entered assumptions, exact ledger, and named source before using lower modeled cost in a decision.
Frequently asked questions
Does wider spacing always save money?
No. Unit cost, productivity, downstream systems, and design requirements can reverse the result.
Are the two walls structurally equal?
The calculator makes no such claim.
Why keep labor rate common?
It isolates spacing, unit cost, and productivity effects; use separate studies if crews differ.
Can I include waste?
Add it consistently to unit costs or counts outside this simplified stud comparison.
Does total include plates and headers?
No. Only planning studs and associated labor are modeled.
What does a negative difference mean?
B is lower than A for that metric.
Can cheaper be slower?
Yes; the page reports cost and duration decisions separately.
Who approves spacing?
The project design, adopted code, and responsible professional.