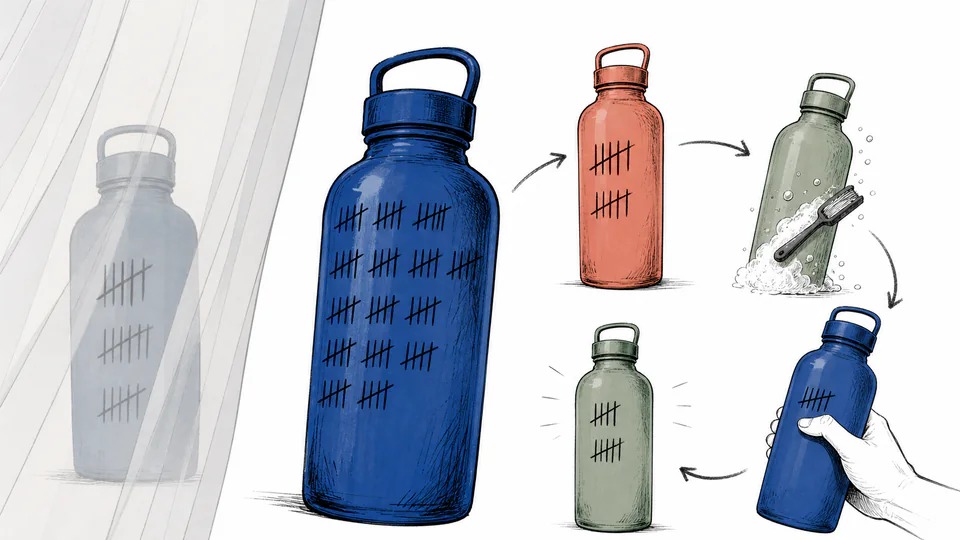
Uneven rotation hides wear
An average can show 80 uses per item while one favorite has 150 and another has 10. Item-level marks improve retirement decisions.
Practical household planning
Turn a use log into effective inventory, uses per item, rated-life utilization, remaining capacity, replacement count, and observed cost per use.
REUSABLE SERVICE-LIFE RECORD
Ownership is not utilization. This calculator converts weekly records into total services, reduces inventory by an explicit loss allowance, distributes use across effective items, and compares that load with rated life. It helps an owner evaluate rotation and replacement evidence; it cannot prove manufacturer durability or environmental benefit.
REUSABLE SERVICE-LIFE RECORD
Utilization above 100 percent indicates recorded demand exceeds the effective rated capacity and triggers whole replacement units in this planning view. Inspect actual item condition rather than retiring or extending use from the percentage alone.
| Usage record | Quantity / basis | Rate / capacity | Calculated state |
|---|
CURRENT CALCULATION PROCESS
E=q(1−ℓ); U=uw; x=U/E; η=100x/L; k=max(0,ceil((U−EL)/L)); CPU=(P(q+k)+Uc+M)/U
Apply loss allowance ℓ to owned count q to form effective inventory E, accumulate recorded uses U, calculate per-effective-item load x and rated-life utilization η, then add whole replacements only when demand exceeds effective rated capacity.
| Symbol | Meaning | Unit | Default |
|---|---|---|---|
| E | Effective inventory | items | calculated |
| q | Originally owned | items | 5 |
| ℓ | Loss allowance | dimensionless | 10% = 0.10 |
| U | Recorded horizon uses | uses | 360 |
| x | Uses per effective item | uses/item | calculated |
| L | Rated life | uses/item | 100 |
| c | Cleaning cost | USD/use | 0.15 |
| M | Maintenance | USD | 20 |
Conversions and rounding: Convert loss percentage once. Treat effective inventory as an expectation, but replacements as whole purchases. Do not round utilization before testing replacement capacity.
HOW TO USE
SUBJECT FUNDAMENTALS
MODEL AND FORMULA
Apply loss allowance ℓ to owned count q to form effective inventory E, accumulate recorded uses U, calculate per-effective-item load x and rated-life utilization η, then add whole replacements only when demand exceeds effective rated capacity.
DEEPER DECISION ANALYSIS
An average can show 80 uses per item while one favorite has 150 and another has 10. Item-level marks improve retirement decisions.
A missing item reduces available capacity but says nothing about durability. Keep causes separate when assessing products.
Heat, chemicals, abrasion, and storage can make a published cycle count inapplicable. Match evidence before comparing utilization.
WORKED DECISION CASES
Marked containers circulate evenly, so average per-item load closely represents each unit and remaining capacity helps schedule inspection.
The system buys replacements despite low wear because items disappear. The response is custody control, not a claim that the product failed early.
TECHNICAL LANGUAGE
EVIDENCE AND DATA LINEAGE
Keep purchase dates and cost, item identifiers, weekly service tallies, cleaning records, repair receipts, unavailable dates, and retirement reason. Photograph or document wear consistently. Manufacturer ratings should be saved with their care conditions and test basis.
LIMITS AND EXCLUSIONS
RELIABLE SOURCES
FREQUENTLY ASKED QUESTIONS
It represents expected availability across the group; it does not claim ownership of part of an item.
No. It means the entered average reached rated capacity; inspect actual condition and follow safety instructions.
Use item-level logs or run separate groups rather than relying on an average.
No. Loss reduces availability but must remain distinct from material or mechanical failure.
Observed service cost should recover acquisition along with entered operations and replacements.
Yes, but cost per use becomes zero in the output because no service denominator exists; interpret the idle system directly.
IMPORTANT NOTE
Follow product care, inspection, and retirement instructions. This page is a record-analysis aid, not a durability certification or safety assessment.