Physics and mechanics
Heat Transfer Scenario Calculator
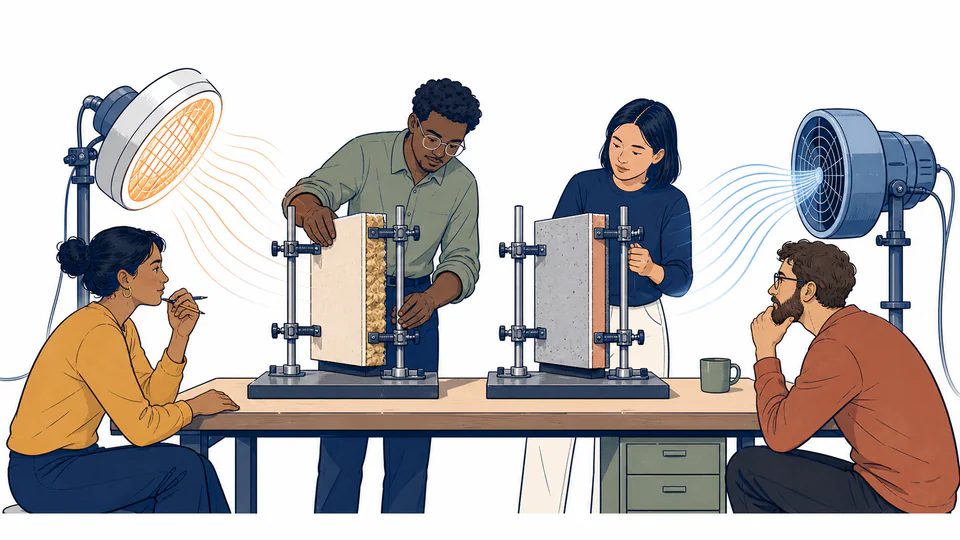
Compare two complete steady plane-wall scenarios and isolate the effects of conductivity, thickness, area, film coefficients, and boundary temperatures.
CURRENT MODEL
Enter the declared thermal case
Design and energy teams comparing a baseline assembly with a material, geometry, boundary, or film-coefficient alternative.
Decision supportedDetermine whether a proposed scenario changes heat flow as intended, identify which assumptions were held constant, and separate one-at-a-time driver effects from combined interaction.
LIVE THERMAL ANALYSIS
Baseline, proposal, and sensitivity bridge
The live bars compare complete scenario magnitudes, then show one-at-a-time changes from baseline and the non-additive interaction remainder.
| Case | Changed basis | Signed rate (W) | R total (K/W) | Magnitude change |
|---|
How to use
Compare two complete thermal cases
- Enter the full baseline material, thickness, area, film coefficients, and boundary temperatures.
- Enter the proposed case independently; do not assume a field is held constant unless both values match.
- Use conductivity data for the relevant mean temperature, moisture, density, and aging condition.
- Review both total-resistance ledgers before comparing rates, especially when area or film coefficients change.
- Read the held-constant register and one-at-a-time bridge to see which assumptions moved.
- Treat the interaction remainder as a coupling diagnostic, then test uncertainty and unmodeled bridges before selecting a design.
Comparison fundamentals
Six rules prevent a misleading scenario
- Complete case
- Each scenario carries its own material, geometry, films, and boundaries.
- Held constant
- An input with exactly the same entered baseline and proposed value.
- Heat-rate magnitude
- Absolute watts used for load comparison while signed direction remains recorded.
- One-at-a-time bridge
- One proposed input group substituted into the baseline case.
- Interaction
- The combined change not reproduced by adding separate bridge effects.
- Reference basis
- The physical conditions under which conductivity and film coefficients apply.
Calculation method
Solve both networks, then bridge each driver
Baseline and proposal are solved with the same plane-wall series network, but none of their seven fields is silently shared. Rate magnitude change is proposed minus baseline; the signed rate remains available in the exact ledger.
Five bridge cases replace conductivity, thickness, area, both film coefficients, or both boundary temperatures on the baseline. Their changes are not assumed additive: the interaction remainder closes the combined result.
Fair material comparison
Hold thickness, area, films, and temperatures fixed when isolating conductivity. A lower k measured under different moisture or temperature conditions is not a controlled substitution.
Geometry coupling
Area appears in every network resistance. Changing it alters film and layer terms together, so a material-only narrative would misstate the design change.
Boundary uncertainty
Film coefficients and bulk temperatures can dominate field performance. Use measured or design-basis ranges rather than a single optimistic operating point.
Magnitude versus direction
A reversed temperature order can produce the same magnitude with opposite direction. The page keeps both so load size and physical flow are not conflated.
Detailed calculation process
Symbols, current substitution, intermediate quantities, and reconciliation
For j in {baseline, proposed}: R_j = 1/(h_hot,j A_j) + L_j/(k_j A_j) + 1/(h_cold,j A_j); qdot_j = delta T_j/R_jAll scenarios and bridge cases use unrounded SI values. Rates show to 0.1 W, percentage changes to 0.1%, and resistances to four decimal places. Equality checks use the entered numeric values.
| Symbol | Meaning | Baseline / proposed | Unit |
|---|---|---|---|
| k_b / k_p | Layer conductivity | 0.04 / 0.035 | W/(m K) |
| L_b / L_p | Layer thickness | 0.05 / 0.08 | m |
| A_b / A_p | Normal area | 10 / 10 | m2 |
| h_hot | Hot-side film coefficient | 10 / 10 | W/(m2 K) |
| h_cold | Cold-side film coefficient | 25 / 25 | W/(m2 K) |
| T_hot / T_cold | Bulk boundary temperatures | 80 / 20 for each | deg C |
| R_j | Total scenario resistance | calculated | K/W |
| qdot_j | Signed scenario rate | calculated | W |
Waiting for valid inputs.
Evidence and measurement
Preserve what changed and why
For each scenario retain product data, conductivity test conditions, installed thickness, net area takeoff, convection correlation or measurement, and boundary-temperature source. Save the input register with the result so a later reviewer can distinguish a product change from a changed operating assumption.
Scope and limitations
What the comparison cannot prove
- Whole-assembly performance with framing, joints, gaps, and fasteners
- Radiation, air leakage, moisture transport, condensation, and solar effects
- Temperature-dependent or anisotropic properties
- Transient startup, storage, or cycling
- Cost, constructability, durability, embodied impacts, or code compliance
- Causal attribution from one-at-a-time sensitivity bars
Each scenario is a one-dimensional, steady, homogeneous plane layer with two convection films and constant properties. The one-at-a-time sensitivity bridge is diagnostic, not a causal attribution when multiple inputs interact.
Key terminology
Scenario-analysis glossary
- Baseline
- The explicit reference case against which changes are measured.
- Proposal
- The complete alternative case, including any changed operating assumptions.
- Controlled comparison
- A comparison that changes only the intended variable or documented group.
- Sensitivity
- The result response to a defined input substitution.
- Interaction remainder
- Combined change minus the sum of separate bridge changes.
- Thermal bridge
- An unmodeled parallel path through a more conductive element.
- Film coefficient
- The convection parameter linking bulk fluid and surface.
- Heat-rate magnitude
- The absolute size of signed power flow.
Practical cases
Two comparisons with different controls
Thicker insulation, same operation
A facility keeps area, films, and process temperatures fixed while increasing thickness and updating material k. The bridge separates the material and thickness effects before combined interaction is reviewed.
Retrofit plus airflow change
A housing study changes insulation and exterior convection after adding a ventilated cavity. The page exposes that two physical mechanisms changed; it does not label the whole rate reduction as material benefit.
Important note
Do not rank products from nominal conductivity alone
Installed assembly performance can be controlled by joints, moisture, compression, bridges, and workmanship. Use this comparison to structure evidence and sensitivity, then verify the complete assembly and governing requirements.
Frequently asked questions
Why does each scenario have its own boundary temperatures?
A fair material comparison normally keeps them equal, but separate fields expose when operating conditions also changed. The held-constant register makes that choice visible.
What does the interaction remainder mean?
It is the combined proposed change minus the sum of one-at-a-time bridge effects. Nonzero interaction appears because area and film or layer resistances enter the network together rather than as independent additive rate changes.
Can I treat the largest sensitivity bar as causal proof?
No. It is a local comparison from the baseline with one proposed input group substituted. Measurement uncertainty, coupled changes, and unmodeled thermal bridges can change the real ranking.
Why compare signed rate and magnitude separately?
The sign records direction from each scenario's hot-labeled boundary to its cold-labeled boundary. Magnitude supports load comparison even if a scenario reverses the entered temperature order.
Does changing area always change heat rate proportionally?
In this plane-wall model every resistance contains area, so total rate is proportional to area when all other values stay fixed. Real edge effects or changing exposed geometry may violate that relationship.
How should I compare different materials?
Use conductivity values for the relevant mean temperature, moisture state, density, and aging condition. Keep thickness, area, film coefficients, and boundary temperatures equal unless the design intentionally changes them.
Authority and follow-on work
Reliable sources and related calculators
- MIT 2.051 heat-transfer equation sheetPlane-wall and convection thermal resistances.
- U.S. DOE heat-transfer handbookConduction, convection, and parameter effects on heat-transfer rate.
- DOE Building Science Education: heat flowPractical cautions about gaps, compression, and real assembly performance.
Related calculators
Continue with a distinct heat-transfer question without silently changing the model boundary.